Abstract
Abstract 178
Leukemic cells are heterogeneous in many ways, and specifically in replication rates. Dormancy and quiescence particularly among leukemia stem cells (LSCs) have been suggested to play a pivotal role in leukemia resistance to chemotherapy. This has been suggested in chronic leukemia, but never proven in acute leukemia, where most cancer cells divide frequently, and it is not known which subpopulation causes relapse. Cell lineage analysis of single leukemia cells can describe the variable kinetics of leukemia subpopulations by studying the evolutionary genetic changes between diagnosis and relapse in the same patient, and hence potentially pinpoint the relapse population already at diagnosis. In the current study a novel methodology was used in order to describe the evolutionary history of single leukemia cells. The reconstruction of phylogenetic trees from single cells can shed light of the relative number of replications of each cell (depth), and the diversity and heterogeneity of the tumor.
Phylogenetic analysis was applied to single cells from peripheral blood of two acute myeloid leukemia (AML) patients (n≂F40 cells from each patient), sampled at diagnosis and relapse. Leukemia and T cells were separated by FACS. T cells, which were not part of the malignant AML clone served for the validation of sorting. Single cells underwent whole genome amplification followed by PCR reactions amplifying 120 microsatellite (MS) loci, using a high throughput robotic and computer aided systems. As MSs accumulate genetic variation during replication, the phylogenetic tree of the malignancies can be reconstructed from the genetic changes in MSs between the cells and the application of a neighbor joining algorithm. The relative depth of cells was calculated from the genetic distance of each cell from the root of the tree, which was designated as the median value of all cells for a specific MS.
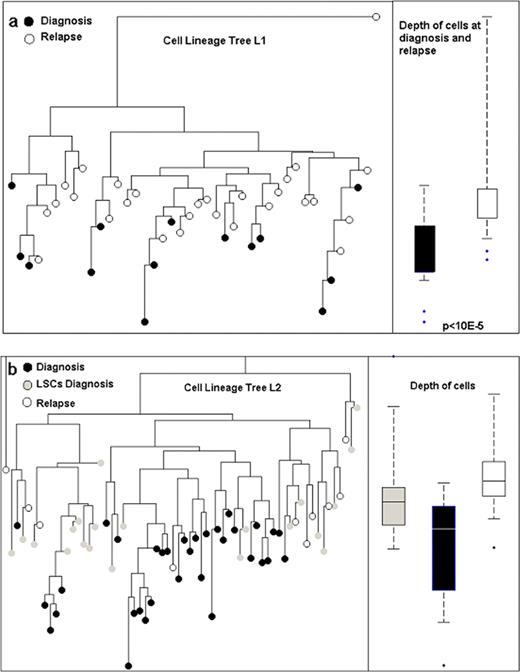
In the reconstructed cell lineage trees of both AML patients (L1 n=41 leukemia cells; L2 n=43 leukemia cells), cells at relapse were shallow compared to cells at diagnosis, implying that they originate from cells that divided rarely prior to relapse (p<10e-5, p<0.0001, L1 and L2 respectively) (Figure 1). Furthermore for patient L2 single LSCs, LIN- CD34+ CD38- CD90+ from diagnosis, were analyzed (n=21 LSCs), and were found to be shallower than the general population of leukemia cells at diagnosis (p=0.01), but deeper than leukemia cells at relapse (p=0.036) (Figure 1). T cells in both AML patients were clustered on a different branch of the lineage tree (L1 n=32, p<10-6; L2 n=29, p=7.4*10-6).
A novel single cell phylogenetic approach applied to AML cells uncovered the role of dormancy and LSCs in AML relapse. As chemotherapy preferentially targets rapidly-dividing cells, dormant cells are positively selected to resist chemotherapy at least in some AML patients. In such cases, in order to prevent relapse, leukemia therapy must also target such rarely-dividing leukemia cells. We have further demonstrated that LSCs are genetically correlated to the rarely dividing cells at relapse. The ability of cell lineage analysis to identify rarely dividing cells and correlate them to LSCs and possibly to normal stem cells already at diagnosis may enable their characterization and hence the design of improved targeted and personalized therapy for leukemia and other types of cancer with similar relapse mechanisms. Furthermore, this evolutionary-based approach can also shed more light on the diversity of leukemia in a time scale and uncover other chemotherapy resistance mechanisms.
Phylogenetic trees of leukemia single cells at diagnosis and relapse from 2 AML patients. a, L1: Left – reconstructed lineage tree of CD33+ CD4+ CD15- peripheral blood (PB) individual leukemia cells at diagnosis (full, n=14); and relapse (blank, n=27) for patient L1; The root was determined by calculation of the median signal of all cells. Right - comparison of median depth between cells at diagnosis (full) and relapse (blank), (p<10^-5). b, L2: Left – reconstructed lineage tree of CD117+ PB individual leukemia blast cells at diagnosis (full, n=33), LSCs LIN-CD34+ CD38- CD90+ (gray, n=21) and relapse(blank, n=10) for patient L2. Right - Comparison of median depth between cells at diagnosis (full) and relapse (blank), (p=0.0001). Y axis represents depth in arbitrary units (logarithmic scale).
Phylogenetic trees of leukemia single cells at diagnosis and relapse from 2 AML patients. a, L1: Left – reconstructed lineage tree of CD33+ CD4+ CD15- peripheral blood (PB) individual leukemia cells at diagnosis (full, n=14); and relapse (blank, n=27) for patient L1; The root was determined by calculation of the median signal of all cells. Right - comparison of median depth between cells at diagnosis (full) and relapse (blank), (p<10^-5). b, L2: Left – reconstructed lineage tree of CD117+ PB individual leukemia blast cells at diagnosis (full, n=33), LSCs LIN-CD34+ CD38- CD90+ (gray, n=21) and relapse(blank, n=10) for patient L2. Right - Comparison of median depth between cells at diagnosis (full) and relapse (blank), (p=0.0001). Y axis represents depth in arbitrary units (logarithmic scale).
Phylogenetic trees of leukemia single cells at diagnosis and relapse from 2 AML patients. a, L1: Left – reconstructed lineage tree of CD33+ CD4+ CD15- peripheral blood (PB) individual leukemia cells at diagnosis (full, n=14); and relapse (blank, n=27) for patient L1; The root was determined by calculation of the median signal of all cells. Right - comparison of median depth between cells at diagnosis (full) and relapse (blank), (p<10^-5). b, L2: Left – reconstructed lineage tree of CD117+ PB individual leukemia blast cells at diagnosis (full, n=33), LSCs LIN-CD34+ CD38- CD90+ (gray, n=21) and relapse(blank, n=10) for patient L2. Right - Comparison of median depth between cells at diagnosis (full) and relapse (blank), (p=0.0001). Y axis represents depth in arbitrary units (logarithmic scale).
No relevant conflicts of interest to declare.
Author notes
Asterisk with author names denotes non-ASH members.


This feature is available to Subscribers Only
Sign In or Create an Account Close Modal