Abstract
Abstract 2557
Stem cell transplantation, better supportive care, and the introduction of “novel agents”, particularly proteosome inhibitors and IMIDS, have improved survival in myeloma. However it is unclear if this improvement is uniform across various demographic subgroups. We present our analysis of a national database which still reveals significant disparities in the outcome of myeloma patients depending on their geographic location and race.
Data on incidence and mortality was obtained from SEER database. Data on individual state myeloma rates was obtained from U.S. Cancer Statistics Working Group. Graphs were obtained from Cancer Mortality Maps and Graphs (NCI). Valuable measures of trends in cancer epidemiology include Annual Percent Change (APC) and Joinpoint analyses (JPC) which measure trends over a long period of time. Information regarding APC and JPC was obtained from the SEER Cancer Statistics Review. Disparities were calculated by the SEER health disparities calculator for differences in mortality across racial groups. Differences between the cohorts dichotomized at the introduction of novel agents (before and after 2000) were also calculated. Absolute mortality difference was assessed by the “Between Group Variance” (BGV). Relative disparity outcome across the 2 cohorts was assessed by “mean log deviation” (MLD) and the Theil index.
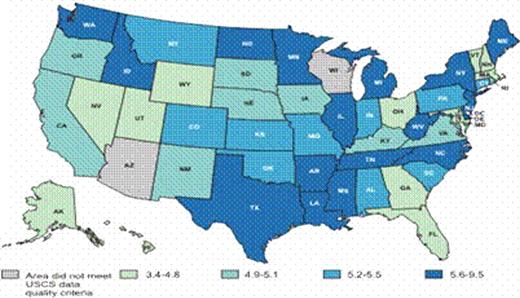
Overall age-adjusted mortality rate was 3.6/100,000 (2002-2006). 5-year relative survival rate was 37% (1999–2005). JPC trends stratified by race indicate a significantly increased JPC modeled incidence of myeloma in blacks to 12.4/100,000 until 1994, declining to 11.2/100,000 in 2006. The mortality rate, with a survival lag effect, also followed the trend in blacks, reaching a peak in 1996 at 7.9/100,000, whereas in whites, the JPC modeled trend was comparatively stable. Significant geographical variation in both incidence and mortality rates of myeloma were observed between different states (see maps). Washington DC and Alabama had the highest mortality rates of 5.3 (SE 0.43) and 4.4 (SE 0.14) per 100,000, whereas Hawaii and Florida had the lowest mortality rates of 2.25 (SE 0.18) and 3.09 (SE 0.05) per 100,000 respectively. The adjusted incidence rate within a state did not significantly correlate with its adjusted mortality rate. State wise comparisons were calculated between black and white races for mortality rates. Differences were found between mortality of blacks and whites in most of the states, which remained nearly constant across both the pre and post novel agent time cohorts. For example, in Washington DC the 1992–2000 and the 2000–2006 cohorts represented a mortality rate of 2.7 and 3.1 respectively for whites, and 7.9 and 7.2 respectively for blacks. An absolute difference in BGV of −21.5 for 2000–2006 cohort compared to 1992–2000 was observed whereas the relative disparity across the 2 cohorts indicated an MLD of −8.57 and a Theil index of -9.45; both indicating an absolute and relative decrease of mortality for the 2000–2006 cohort. When compared to 1992–2000, the percent change in mortality for 2000–2006 was −5.5 in whites and −9.2 in blacks.
A wide variation in myeloma incidence and mortality was observed with respect to race and geography. While differences in incidence rates can be attributed to various epidemiological factors, the socioeconomic issues and differences in disease biology may explain the differences in mortality. Based on our results, we hypothesize that variations in clinical practice, due to lack of standardization may also contribute to the disparities in mortality. Previous studies have demonstrated comparable survival between blacks and whites given comparable treatment. While new approaches have contributed to improved mortality within the 2 studied cohorts of pre and post-novel agent era, the disparity in mortality between whites and blacks has remained constant. This is the first study to our knowledge, which has analyzed the inter-state disparities in mortality and disparities between black and white mortality before and after the introduction of novel agents for myeloma, in a representative sample of national dataset. Further studies are necessary to evaluate various factors that are responsible for the observed mortality differences.
Age Adjusted Incidence rates 2006
Age-adjusted Mortality rates 2006
No relevant conflicts of interest to declare.
Author notes
Asterisk with author names denotes non-ASH members.


This feature is available to Subscribers Only
Sign In or Create an Account Close Modal