Abstract
Abstract 2933
Survival analysis need of large period of time for getting results. Survival subrogates variables provide with earlier data for clinical decisions. The current treatment paradigm is nowadays how the quality of the different treatment responses impact in patient's survival with the new treatment options. Azacitidine (AZA) is a hypomethilating agent which was available for clinical trials or compassionate use in Spain before receiving it marketing authorization in May 2009. We present the final analysis from those patients diagnosed with mielodysplastic syndromes (MDS) or acute myeloid leukemia (AML) selected from a longitudinal, multicenter Spanish patient registry.
This analysis retrospectively gathers clinical data about the treatment, disease progression and survival of patients with MDS or AML who had received AZA 75mg/m2 in compassionate use conditions, with a dosage regimen documented. Three different dosage regimens at the beginning of each 28-day cycle were used; group A: days 1–5 (M-F)/group B: days 1–5, 8–9 (M-F, M-Tu)/group C: days 1–7 (M-Su). Survival analysis was stratified by patients' basal conditions, dosage schedule and best response after 4th and 6th cycles.
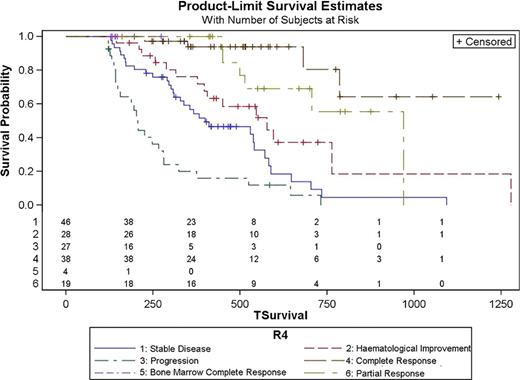
Data were collected from 200 patients with MDS or AML according to the WHO diagnostic criteria. Basal data, effectiveness results and data from haematological tolerance are mainly summarized in table 1. Median survival time was 706 days (95% CI 588–1093) in those patients who achieved a response versus 225 days (95% CI 156–319) in those who did not. Survival analysis showed differences based on the best response achieved (p<0.0001), the response achieved after the 4th cycle (p<0.0001) and the response achieved after the 6th cycle (p<0.0001). Survival Hazard Ratios based on the best response, the responses after 4th and 6th cycles are summarized in table 2. Figures 1 and 2 shows survival curves based on best response after 4 and 6 cycles of therapy.
These in routine clinical practice data confirms those survival data previously published. Although results of AZA-001 show CR is sufficient but not necessary to prolong OS; our data shows an increase in the risk of not being alive when decreasing the quality of the best response achieved by patients during the treatment. To achieve the best response after the 4th cycle could be an AZA treatment goal.
| Dosage group (Days of administration of AZA 75 mg/m2 in each 28-day cycle) . | A (M-F) . | B (M-F + M-Tu) . | C (M-Su) . | P-Value . |
|---|---|---|---|---|
| N | 66 | 56 | 78 | |
| Age (median, years) | 69 | 67 | 67 | 0.6685 |
| Sex (male, %) | 64.3 | 69.7 | 66.7 | 0.5863 |
| Primary MDS (%) | 83.3 | 89.3 | 78.2 | 0.3694 |
| Secondary MDS (%) | 7.6 | 3.6 | 10.3 | |
| AML (%) | 1.5 | 3.6 | 7.7 | |
| Refractory AML (%) | 6.1 | 3.6 | 3.8 | |
| Unknown ECOG Status (%) | 10.6 | 7.1 | 11.5 | 0.1767 |
| ECOG Status 0 (%) | 25.8 | 14.3 | 17.9 | |
| ECOG Status 1 (%) | 40.9 | 64.3 | 41.0 | |
| ECOG Status 2 (%) | 18.2 | 8.9 | 23.1 | |
| ECOG Status 3 (%) | 4.5 | 5.4 | 6.4 | |
| Unknown IPSS Risk Score (%) | 10.6 | 10.6 | 12.9 | 0.9357 |
| IPSS Low Risk (%) | 19.7 | 17.9 | 12.8 | |
| IPSS Int-1 Risk (%) | 42.4 | 41.1 | 34.6 | |
| IPSS Int-2 Risk (%) | 22.7 | 21.4 | 19.2 | |
| IPSS High Risk (%) | 4.5 | 10.7 | 12.8 | |
| Overall Response (%) | 42.5 | 63.2 | 56.4 | 0.1095 |
| Complete response (%) | 16.7 | 37.5 | 32.1 | |
| Partial response (%) | 9.1 | 10.7 | 12.8 | |
| Bone marrow complete response (%) | 9.1 | 8.9 | 5.1 | |
| Hematological response (%) | 7.6 | 16.1 | 6.4 | |
| Stable disease (%) | 25.8 | 16.1 | 19.2 | |
| One Year Survival Rate (%) | 52.2 | 69.02 | 57.56 | 0.5066 |
| Grade ≥3 neutropenia (%) | 48.5 | 44.6 | 32.1 | 0.0434 |
| Grade ≥3 thrombocytopenia (%) | 36.4 | 28.5 | 27.0 | 0.228 |
| Grade ≥3 anemia (%) | 33.3 | 21.5 | 25.6 | 0.3253 |
Percentages (Chi-Square Test, Exact's Fisher Test, LR Test according to application criteria met), Median +/− IQR (Kruskal-Wallis Test) or Median +/− Std (T-Test) when applicable.
Survival and Best Response Hazard Ratios
| . | Best Response . | Best Response after 4 cycles . | Best Response after 6 cycles . |
|---|---|---|---|
| Complete Response | 1 | 1 | 1 |
| Bone Marrow Complete Response | 2.63 | none | 3.18 |
| Partial Response | 1.26 | 2.46 | 1.23 |
| Haematological Improvement | 0.99 | 5.70 | 0.92 |
| Stable Disease | 5.17 | 10.62 | 3.82 |
| Disease Progression | 12.22 | 25.52 | 7.54 |
| Treatment Failure | 16.27 | none | none |
García:Celgene: Research Funding. de Miguel LLorente:Celgene: Speakers Bureau. Bargay:Celgene: Research Funding. Ramos:Celgene: Speakers Bureau. Sanz:Celgene: Speakers Bureau. Sánchez:Celgene: Speakers Bureau.

This icon denotes an abstract that is clinically relevant.
Author notes
Asterisk with author names denotes non-ASH members.


This feature is available to Subscribers Only
Sign In or Create an Account Close Modal