Abstract
The acute phase protein serum amyloid A (SAA) has been well characterized as an indicator of inflammation. Nevertheless, its functions in pro versus anti-inflammatory processes remain obscure. Here we provide unexpected evidences that SAA induces the proliferation of the tolerogenic subset of regulatory T cells (Treg). Intriguingly, SAA reverses Treg anergy via its interaction with monocytes to activate distinct mitogenic pathways in Treg but not effector T cells. This selective responsiveness of Treg correlates with their diminished expression of SOCS3 and is antagonized by Treg–specific induction of this regulator of cytokine signaling. Collectively, these evidences suggest a novel anti-inflammatory role of SAA in the induction of a micro-environment that supports Treg expansion at sites of infection or tissue injury, likely to curb (auto)-inflammatory responses.
Introduction
Inflammation is a highly regulated physiologic response that has evolved as a mechanism to respond to infection as well as to promote healing in settings such as tissue injury. CD4+ regulatory T cells (Treg) are observed at sites of acute and chronic inflammation,1,2 raising questions as to the molecular basis of their accumulation at these sites. Initial evidence suggested that immunosuppressive activities of Treg are diminished in the presence of inflammatory signals.3,4 However, in several studies, the apparently opposite picture emerged, wherein Treg exposed to inflammatory signals retain potent suppressive activity. For instance, murine Treg at sites of viral infection or isolated from inflamed tissues still mediate regulatory function,5-7 as do human Treg isolated from rheumatoid joints or inflamed colonic mucosa.8,9 Collectively, these results point to the possibility that certain signals associated with inflammation might promote Treg activity. Here we unexpectedly identified serum amyloid A (SAA), an acute indicator of inflammation, as a novel factor that induces cellular and cytokine conditions to support the expansion of Treg while maintaining their suppressive capacity.
Methods
In vivo effects of SAA on Treg proliferation
C57BL6/J mice (male, 8-10 weeks old) were purchased from Jackson Laboratory. Mice were injected intraperitoneally with recombinant human SAA (Peprotech, 30 μg in 100 μl PBS), purified human serum albumin (Sigma-Aldrich, 30 μg in 100 μl PBS), or endotoxin (Sigma-Aldrich, 0.25 ng in 100 μl PBS). Animals were killed 16 hours later; peritoneal cells were harvested and stained for surface and intracellular markers to detect Treg frequency and proliferation. In vivo depletion of monocytes was performed with clodronate liposomes (Encapsula). In these experiments, 400 μL of clodronate or empty liposomes were injected intraperitoneally 24 hours before SAA injection.
Flow cytometry and ELISA
Detection of surface markers and intracellular molecules was performed. Antibodies to mouse and human proteins used in these experiments are purchased from Biolegend except for anti–human formyl peptide receptor like-1 (FPRL-1; R&D Systems), anti–human RAGE (receptor of advanced glycation end products), supressor of cytokine signaling 3 (SOCS3; Abcam), and anti–Ki-67, anti–human-pAKT (phosphonylated protein kinase B), pERK1/2 (phosphorylated extracellular signal regulated kinases 1 and 2; BD Biosciences). For in vitro experiments, the relevant subset was labeled with CFSE before suppression assays. Cells were pelleted at various time points and underwent standard staining protocols of the manufacturers. For in vivo experiments, cells were harvested from peritoneal cavity and underwent flow cytometric analysis.
To detect cytokines in the plasma, cytometric bead arrays (BD Biosciences) and ELISA (R&D Systems) were used according to manufacturers' protocols.
Human plasma preparation
The study was approved by the Institutional Review Board at Stanford University. All subjects provided informed consent before participating in the study in accordance with the Declaration of Helsinki. Plasma was prepared from whole, anticoagulated blood within 2 hours after blood draw. Whole blood samples were centrifuged at 25°C at 514g for 5 minutes to remove cells, and then underwent 2 additional rounds of centrifugation at 4°C at 1730g for 5 and 15 minutes, respectively to remove platelets. Final plasma samples were stored at −80°C until analysis. Depletion of SAA from plasma samples was performed with anti-SAA antibodies (Santa Cruz Biotechnology) via immunoprecipitation for 4 consecutive rounds. Negative control for depletion experiments was performed with L243 (anti–HLA-DR) antibodies.
Human cell isolation
CD4+ T cells were purified with CD4+ Rosette Kit (StemCell Technologies) from buffy coats. The CD4+ T cell fraction was then incubated with anti-CD25 microbeads (Miltenyi Biotech) to isolate CD4+CD25+ cells. The flow-through fraction after magnetic purification contained CD4+CD25− Teff. All procedures were performed according to manufacturers' standard protocols. CD4+CD25+ T cells were incubated with anti-CD127–APCs, anti-CD25–PE, and anti-CD4–FITC antibodies (BD Biosciences) before undergoing flow cytometric sorting for CD4+CD25+CD127lo/− Treg and CD4+CD25+CD127+ activated Teff. Purity of sorted cells was confirmed to be higher than 95% by Foxp3 staining (eBioscience; data not shown). Cells were rested for 2 hours in 37°C incubator before being used in suppression assays.
Suppression assays
Standard 3H-thymidine-based suppression assays were performed. Autologous Treg and Teff were cultured at 3750 cells per 50 μl per well in complete media (RPMI+10%FBS+1%l-glutamine) with allogeneic irradiated CD3-depleted peripheral blood mononuclear cells (APCs), at 37 500 cells per 50μl per well. Anti-CD3 antibodies (clone UCHT1; BD Biosciences) were precoated on U-bottom 96 well plates at 5 μg/mL for 4 hours at 37°C before suppression assays. Additional media was added so the final volume in each well was 200 μl. On day 6, cells were pulsed with 1 μCi 3H-thymidine (25 μl) per well and harvested on day 7 with a Tomtec cell harvester. 3H-thymidine incorporation was determined using a 1450 microbeta Wallac Trilux liquid scintillation counter.
For suppression assays without APCs, anti-CD3 antibodies at 5 μg/mL final concentration (clone UCHT1; BD Biosciences) were plate-bound in U-bottom 96-well plates for 4 hours at 37°C. Soluble anti-CD28 (5 μg/mL; BD Biosciences) was added, followed by Teff (40 000 cells per 50 μl per well) and Treg (40 000 cells per 50 μl per well). For CFSE dilution assay, Treg were labeled with CFSE using Cell Tracer CFSE Cell Proliferation kit (Molecular Probes) at a final concentration of 10μM, according to manufacturer's instructions. Assays with labeled cells were performed as described for 3H-thymidine-based suppression assays.
To evaluate effects of plasma on suppression assays and immune cell cultures, frozen plasma samples were thawed at 25°C and debris were removed with sterile 40μm filters (BD Biosciences). All plasma samples were tested in duplicates or triplicates. To control for variations in suppressive and proliferative potentials of Treg and Teff, respectively, both HC and SJIA plasma samples were used in parallel suppression assays with the same set of purified cells for each round of experiments. In addition, fold change in 3H-thymidine cpm in assays with plasma compared with those in complete media alone, was computed to analyze the effects of plasma in suppression assays or stimulation assays. In CFSE assays, percentage of proliferating cells (shown by dye dilution) was used to analyze the effects of plasma on cell proliferation.
Statistical analysis
All statistical procedures were performed with Prism Version 5.0 software (GraphPad). Data were tested for normality (Koromonov-Smirnov test) and variance equality (Bartlett test) before being subjected to appropriate statistical tests. Differences with P < .05 were considered statistically significant. Correction for multiple comparisons was performed via Bonferroni method.
Results
SAA induces Treg proliferation
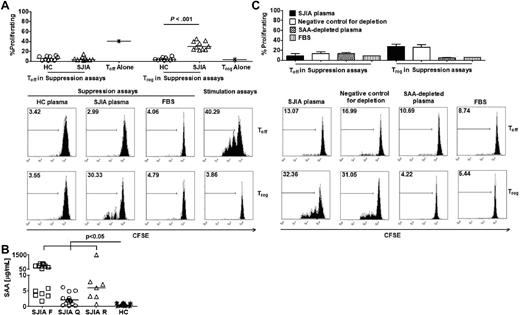
To dissect the effects of molecules associated with inflammation on Treg, we first sought to simulate this environment in vitro using plasma from children with systemic juvenile idiopathic arthritis (SJIA), and auto-inflammatory disease, in which elevated levels of both markers of inflammation and inflammatory cytokines are present. Addition of a titrated volume of SJIA plasma (15%) from subjects with various degrees of disease activity flare (F, active disease), quiescence (Q, inactive disease on medication), or remission (R, inactive disease off medication)], but not healthy control (HC) plasma, to 3H-thymidine-based suppression assays, stimulated cell proliferation (supplemental Figure 1, available on the Blood Web site; see the Supplemental Materials link at the top of the online article). Surprisingly, CFSE-based suppression assays revealed that the presumably anergic population of Treg was proliferating and continued to suppress the proliferation of effector T cells (Teff; Figure 1A).
Endogenous SAA is the SJIA plasma factor required for the reversal of Treg anergy. (A top) Percentages of proliferating Teff and Treg in suppression assays with HC plasma (n = 10) and SJIA plasma (n = 10) or in stimulation assays. (Bottom) Representative FACS plots of CFSE staining to track proliferation of Treg and Teff in suppression assays. (B) SAA levels in SJIA plasma at different disease stages (flare-F n = 16, quiescence-Q n = 17, remission-R n = 7) and HC plasma (n = 14). (C top) Effects of SAA-depleted SJIA plasma on Teff and Treg proliferation in suppression assays (n = 2). Negative control for SAA depletion was performed with anti–HLA-DR antibody. (Bottom) Representative FACS plots of CFSE staining to track proliferation of Treg and Teff in suppression assays. Unpaired 2-tailed t tests (A) and ANOVA (B) were used for statistical analyses. Horizontal bars represented median values; bar graphs represented means and SEs where indicated throughout the figure.
Endogenous SAA is the SJIA plasma factor required for the reversal of Treg anergy. (A top) Percentages of proliferating Teff and Treg in suppression assays with HC plasma (n = 10) and SJIA plasma (n = 10) or in stimulation assays. (Bottom) Representative FACS plots of CFSE staining to track proliferation of Treg and Teff in suppression assays. (B) SAA levels in SJIA plasma at different disease stages (flare-F n = 16, quiescence-Q n = 17, remission-R n = 7) and HC plasma (n = 14). (C top) Effects of SAA-depleted SJIA plasma on Teff and Treg proliferation in suppression assays (n = 2). Negative control for SAA depletion was performed with anti–HLA-DR antibody. (Bottom) Representative FACS plots of CFSE staining to track proliferation of Treg and Teff in suppression assays. Unpaired 2-tailed t tests (A) and ANOVA (B) were used for statistical analyses. Horizontal bars represented median values; bar graphs represented means and SEs where indicated throughout the figure.
To characterize the factor(s) in SJIA plasma that induced Treg proliferation, we measured the serum levels of various inflammatory markers and found significant increases in some cytokines in plasma samples collected at SJIA flare compared with HC plasma (supplemental Figure 2). Noticeably, SJIA plasma samples from all disease stages had significantly higher levels of SAA than samples from HC (Figure 1B). More importantly, depletion of SAA in SJIA plasma abrogated Treg proliferation (Figure 1C, supplemental Figure 3), suggesting that this acute phase protein is required for the mitogenic effects of SAA.
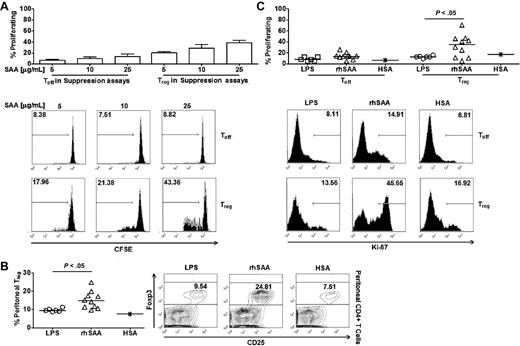
To determine whether SAA is sufficient to reverse Treg anergy, recombinant SAA was added to suppression assays, in the presence of polymixin to inhibit any contaminating LPS. Recombinant SAA was able to selectively enhance proliferation of Treg without reducing their suppressive activity (Figure 2A). Furthermore, there was a significant increase in Treg abundance in the peritoneal cavity of SAA-injected mice compared with those injected with a control protein, (purified human serum albumin) or endotoxin at the level found in recombinant SAA (0.25ng/mL; Figure 2B). Concurrently, a significantly higher percentage of peritoneal Treg from SAA-injected mice expressed the nuclear antigen Ki-67, indicating that they were undergoing cell division (Figure 2C). In contrast, SAA injection did not enhance Teff proliferation (Figure 2C). Collectively, these results demonstrate that SAA is a novel mitogenic stimulator of Treg.
Exogenous SAA selectively induces Treg proliferation. (A top) Effects of recombinant SAA at different doses on Treg and Teff proliferation in suppression assays (n = 2). (Bottom) Representative FACS plots of CFSE staining to track proliferation of Treg and Teff in suppression assays. (B left) Frequency of Treg out of total peritoneal CD4+ T cells collected 16 hours after intraperitoneal injection with endotoxin (n = 7), recombinant human SAA (rhSAA, n = 10), and human serum albumin (HSA, n = 1). Recombinant SAA and HSA were used at 30 μg per injection in 100 μL PBS. LPS were injected at concentration similar to the level detected in recombinant SAA solution (0.25 pg/mL). (Right) Representative FACS plots of Treg frequency in peritoneal fluid. (C top) Percentages of proliferating Teff and Treg in peritoneal fluid after SAA injection. (Bottom) Representative FACS plots of percentages of proliferating Teff and Treg in peritoneal fluid. Unpaired 2-tailed t tests (B-C) were used for statistical analyses. Horizontal bars represented median values; bar graphs represented means and SEs where indicated throughout the figure.
Exogenous SAA selectively induces Treg proliferation. (A top) Effects of recombinant SAA at different doses on Treg and Teff proliferation in suppression assays (n = 2). (Bottom) Representative FACS plots of CFSE staining to track proliferation of Treg and Teff in suppression assays. (B left) Frequency of Treg out of total peritoneal CD4+ T cells collected 16 hours after intraperitoneal injection with endotoxin (n = 7), recombinant human SAA (rhSAA, n = 10), and human serum albumin (HSA, n = 1). Recombinant SAA and HSA were used at 30 μg per injection in 100 μL PBS. LPS were injected at concentration similar to the level detected in recombinant SAA solution (0.25 pg/mL). (Right) Representative FACS plots of Treg frequency in peritoneal fluid. (C top) Percentages of proliferating Teff and Treg in peritoneal fluid after SAA injection. (Bottom) Representative FACS plots of percentages of proliferating Teff and Treg in peritoneal fluid. Unpaired 2-tailed t tests (B-C) were used for statistical analyses. Horizontal bars represented median values; bar graphs represented means and SEs where indicated throughout the figure.
Mitogenic effects of SAA on Treg requires its interaction with monocytes
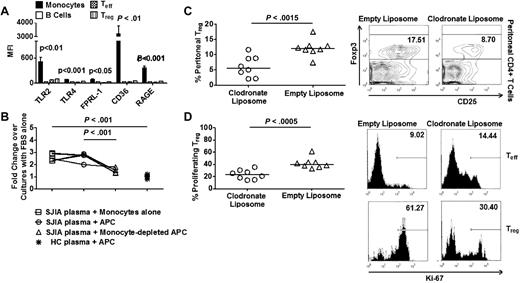
It is known that SAA interacts with at least 6 distinct receptors: FPRL-1, CD36, RAGE, TLR2, TLR4, and Tanis,10-14 which are found to be expressed at strikingly high levels in monocytes compared with B cells and T cells (Figure 3A). To explore the possibility that SAA might act on monocytes to indirectly induce Treg proliferation, we first performed suppression assays with anti-CD3 and anti-CD28 antibodies as T cell stimuli in the absence of APCs. Under this condition, both SJIA plasma-derived and exogenous SAA failed to induce Treg proliferation (supplemental Figure 4), indicating that cells in the APC mixture mediated the mitogenic effect of SAA on Treg. More importantly, depleting monocytes led to a significant decrease in cell proliferation in suppression assays with SAA derived from SJIA plasma (Figure 3B). Conversely, monocytes were sufficient to induce cell proliferation at similar levels to those observed using unfractionated APCs (Figure 3B). In contrast, B cells were not required for the mitogenic effects of SAA derived from SJIA plasma on Treg proliferation in suppression assays (supplemental Figure 4B). To further investigate the role of monocytes on SAA-induced Treg proliferation, we depleted monocytes in vivo with clodronate liposomes (supplemental Figure 4C) and found a significant decrease in Treg abundance and their expression of Ki-67 in the peritoneal cavities of SAA-treated animals (Figure 3C-D). Altogether, these results showed that monocytes were essential for the mitogenic effects of SAA on Treg.
Monocytes are required for mitogenic effects of SAA on Treg. (A) Expression of TLR2, TLR4, FPRL-1, CD36, and RAGE by immune cell subsets (n = 6). (B) Suppression assays with SJIA plasma and HC plasma in the presence or absence of monocytes (n = 5). (C left) Frequency of Treg in peritoneal fluid collected 16 hours after intraperitoneal injection with recombinant human SAA (rhSAA) in monocyte-depleted mice (n = 8). 400 μL of liposome solution (clodronate vs empty) was injected intraperitoneally 24 hours before SAA injection. (Right) Representative FACS plots of Treg frequency in peritoneal fluid. (D left) Percentage of proliferating Treg in peritoneal fluid after SAA injection in monocyte-depleted mice. (Right) Representative FACS plots of percentages of proliferating Teff and Treg in peritoneal fluid. Paired ANOVA (A), paired 2-tailed t tests (B), and unpaired 2-tailed t tests (C-D) were used for statistical analyses. Horizontal bars represented median values; bar graphs represented means and SEs where indicated throughout the figure.
Monocytes are required for mitogenic effects of SAA on Treg. (A) Expression of TLR2, TLR4, FPRL-1, CD36, and RAGE by immune cell subsets (n = 6). (B) Suppression assays with SJIA plasma and HC plasma in the presence or absence of monocytes (n = 5). (C left) Frequency of Treg in peritoneal fluid collected 16 hours after intraperitoneal injection with recombinant human SAA (rhSAA) in monocyte-depleted mice (n = 8). 400 μL of liposome solution (clodronate vs empty) was injected intraperitoneally 24 hours before SAA injection. (Right) Representative FACS plots of Treg frequency in peritoneal fluid. (D left) Percentage of proliferating Treg in peritoneal fluid after SAA injection in monocyte-depleted mice. (Right) Representative FACS plots of percentages of proliferating Teff and Treg in peritoneal fluid. Paired ANOVA (A), paired 2-tailed t tests (B), and unpaired 2-tailed t tests (C-D) were used for statistical analyses. Horizontal bars represented median values; bar graphs represented means and SEs where indicated throughout the figure.
Induction of SOCS3 in Treg antagonizes their SAA-driven proliferative response
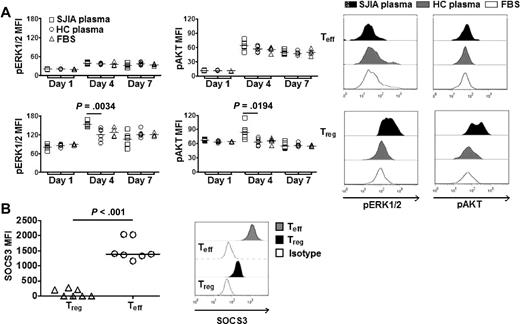
We next examined the activation state of signaling molecules that have been implicated in mitogenic processes, such as AKT and ERK1/2 in Treg in suppression assays. We found that Treg selectively exhibited increased activation of AKT (pAKT) and ERK1/2 (pEKR1/2) in response to SAA derived from SJIA plasma (Figure 4A). Furthermore, Treg also expressed significantly higher levels of pAKT and pERK1/2 than Teff (supplemental Figure 5). Intriguingly, we found that SOCS3, a member of suppressor of cytokine signaling protein family,15 was expressed at significantly lower levels in Treg compared with Teff (Figure 4B).
SAA activates distinct mitogenic pathways in Treg. (A left) Real-time quantitation of ERK1/2 and AKT phosphorylation (pERK1/2 and pAKT) by phospho flow cytometry. Teff (top) or Treg (bottom) were labeled with CFSE. Data were collected at different time points (days 1, 4, and 7) during suppression assays with SJIA plasma (n = 6), HC plasma (n = 6) or complete media (FBS, n = 4). (Right) Representative FACS plots of pERK1/2 and pAKT in Treg and Teff in suppression assays. (B left) Expression of SOCS3 in Treg and Teff (n = 7). (Right) Representative FACS plots of expression of SOCS3 in Treg and Teff.
SAA activates distinct mitogenic pathways in Treg. (A left) Real-time quantitation of ERK1/2 and AKT phosphorylation (pERK1/2 and pAKT) by phospho flow cytometry. Teff (top) or Treg (bottom) were labeled with CFSE. Data were collected at different time points (days 1, 4, and 7) during suppression assays with SJIA plasma (n = 6), HC plasma (n = 6) or complete media (FBS, n = 4). (Right) Representative FACS plots of pERK1/2 and pAKT in Treg and Teff in suppression assays. (B left) Expression of SOCS3 in Treg and Teff (n = 7). (Right) Representative FACS plots of expression of SOCS3 in Treg and Teff.
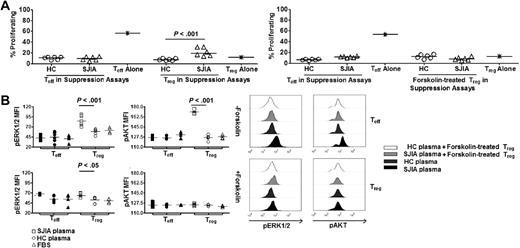
To test the hypothesis that the difference in SOC3 expression in Treg and Teff regulates their proliferative selective response to SAA derived from SJIA plasma, we attempted modulated SOCS3 expression in Treg using Forskolin (supplemental Figure 6A), a reagent known to induce SOCS3 expression in various cell types16,17 SOCS3 expression by Treg, initially induced by forskolin, remained at a level comparable to that in Teff during the suppression assays (supplemental Figure 6B-C). Remarkably, forskolin-treated Treg still suppressed Teff proliferation, but they no longer proliferated in response to SAA derived from SJIA plasma (Figure 5A). The increased activation of mitogenic signaling in Treg compared with Teff cocultured in the same assays was also abrogated (Figure 5B). Collectively, these results suggested that the level of expression of SOCS3 by Treg regulates the dynamic range of their proliferative response to SAA.
SOCS3 regulates mitogenic signaling cascade in Treg in response to SAA. (A left) Percentages of proliferating Treg and Teff in suppression assays with HC plasma (n = 5) and SJIA plasma (n = 5). (Right) Percentages of proliferating forskolin-treated Treg and untreated Teff in suppression assays with HC plasma (n = 5) and SJIA plasma (n = 5). Treg were rested in complete media or treated with forskolin for 24 hours before being used in these assays. (B left) Effects of Treg specific-SOCS3 modulation on phosphorylation status of ERK1/2 and AKT by Treg and Teff in suppression assays. Data were collected at day 4 during suppression assays with SJIA plasma (n = 6), HC plasma (n = 6) or complete media (FBS, n = 4). (Right) Representative FACS plots of pERK1/2 and pAKT in Treg and Teff in suppression assays. Unpaired 2-tailed t tests (A,C,D) and paired 2-tailed t tests (B) were used for statistical analyses. Horizontal bars represented median values.
SOCS3 regulates mitogenic signaling cascade in Treg in response to SAA. (A left) Percentages of proliferating Treg and Teff in suppression assays with HC plasma (n = 5) and SJIA plasma (n = 5). (Right) Percentages of proliferating forskolin-treated Treg and untreated Teff in suppression assays with HC plasma (n = 5) and SJIA plasma (n = 5). Treg were rested in complete media or treated with forskolin for 24 hours before being used in these assays. (B left) Effects of Treg specific-SOCS3 modulation on phosphorylation status of ERK1/2 and AKT by Treg and Teff in suppression assays. Data were collected at day 4 during suppression assays with SJIA plasma (n = 6), HC plasma (n = 6) or complete media (FBS, n = 4). (Right) Representative FACS plots of pERK1/2 and pAKT in Treg and Teff in suppression assays. Unpaired 2-tailed t tests (A,C,D) and paired 2-tailed t tests (B) were used for statistical analyses. Horizontal bars represented median values.
Discussion
In human diseases that are characterized by inflammation, increased numbers of Treg have been found in inflamed tissues where local SAA production occurs.18-20 SAA is elevated within the same time-frame of accumulation of Treg during tissue injury.21,22 Together with our in vivo data, these observations are consistent with the possibility that early induction of SAA at inflammatory sites, coupled with its effects on innate immune cells, generates a milieu that drives Treg proliferation. Our study also suggests that modulating the level of expression of SOCS3 in Treg and, consequentially, the relative expression of SOCS3 in Treg versus Teff by pharmacologic means abrogates the selective activation of mitogenic signaling pathways in Treg on exposure to the micro-environment generated by interaction between SAA and monocytes. These results imply that maintenance versus resolution of inflammatory processes might depend on the relative responsiveness of proinflammatory/effector and anti-inflammatory/regulatory cell subsets. Reduced SOCS3 expression in regulatory cell subsets, such as Treg, might increase their sensitivity to inflammation-derived mitogenic signals, leading to their rapid activation and effective suppression of inflammatory cell types. It is of interest that mediators that could induce SOCS3 expression, such as IL-10, are also produced by Treg and therefore might serve as negative feedback regulators of Treg proliferation to exert a fine balance on tolerance versus immunity under inflammatory conditions.
Inflammation associated with infection or tissue injury affords an opportunity for molecular mimicry or exposure of previously cryptic tissue antigens to increase the risk of autoimmunity. These possibilities highlight the need for timely recruitment and/or expansion of tolerogenic cell subsets at inflammatory sites. The mitogenic effects of SAA on Treg shown here may represent a mechanism for protection against the potential breach of tolerance unleashed by inflammation.
The online version of this article contains a data supplement.
The publication costs of this article were defrayed in part by page charge payment. Therefore, and solely to indicate this fact, this article is hereby marked “advertisement” in accordance with 18 USC section 1734.
Acknowledgments
We are grateful to Jonathan Rothbard (Fathman Laboratory, Stanford University) and Ken Lau and Jim Schilling (Pediatric Biotechnology Core, Stanford University) for their help and guidance with biochemical analysis of plasma samples. We thank Ariana Peck and Julia Buckingham (Mellins Laboratory, Stanford University) for help with cytokine detection in plasma samples and flow cytometry and data acquisition. We thank the members of the Division of Pediatric Rheumatology, Lucile Packard's Children Hospital at Stanford.
This work was supported by the National Institutes of Health, the Dana Foundation, the Wasie Foundation, and the Pediatric Research Fund at Stanford (E.D.M.); the Stanford Graduate Fellowship (K.D.N.); the Parker B. Francis Fellowship (K.C.N.); and the American College of Rheumatology Research and Education Physician Scientist Development Award and the Training Program in Adult and Pediatric Rheumatology (J.L.P.)
National Institutes of Health
Authorship
Contribution: K.D.N., C.M., K.C.N., and E.D.M. are involved in project planning; K.D.N, C.M., K.C.N., P.T., and T.Y. performed experiments and analyzed the results; T.L. and J.L.P. provided clinical samples for the project; and K.D.N. and E.D.M. wrote the manuscript.
Conflict-of-interest disclosure: The authors declare no competing financial interests.
Correspondence: Khoa D. Nguyen; Immunology Program, Stanford University, 259 Campus Dr, CCSR2120, Stanford, CA 94305; e-mail: kdnguyen@stanford.edu.

This feature is available to Subscribers Only
Sign In or Create an Account Close Modal