Abstract
Abstract 1088
MRI estimates are gradually replacing liver biopsy for liver iron concentration (LIC) measurements in clinical trials and in clinical practice. The MRI parameters R2 and R2* can both be used for this purpose but there has never been a multi-institutional comparison of these two metrics. The Phase II trial of FBS0701, a novel oral iron chelator, measured LIC by both R2 and R2* at screening, 12 weeks, and 24 weeks of therapy; nine thalassemia centers participated in 7 countries. We compared LIC estimates calculated by Ferriscan and R2* using screening MRI data from 69 iron overloaded subjects.
All MRI data were collected at 1.5 Tesla using Philips Achieva(N=4), Siemens Avanto (N=3), and General Electric LX (N=1) scanners. Liver R2 was collected and analyzed using a FDA-approved protocol and a commercial vendor (Ferriscan, Resonance Health, Australia). Liver R2* was measured single (N=1) or multiple echo (N=6) gradient echo sequences with minimum echo times ranging from 1.0–1.2 ms. Each site used their own local protocol for R2* acquisition. All gradient echo images were transferred to a central core laboratory for R2* calculation using a three component decay model (exponential + offset). Both R2 and R2* values were converted to equivalent LIC values (mg/g dry weight) using previously validated calibration curves. Absolute and relative Bland Altman statistics were used to compare the two techniques (JMP 5.1, Cary, North Carolina).
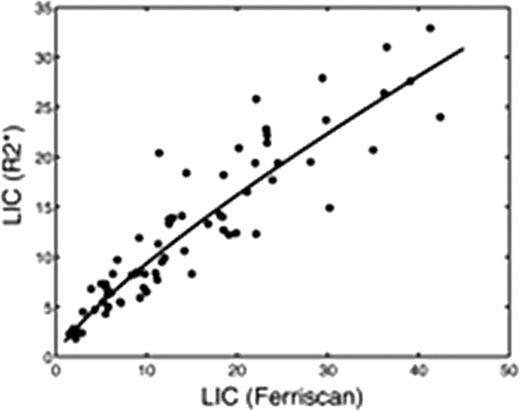
Screening LIC values averaged 15.0 ± 10.5 mg/g for Ferriscan R2 versus 12.7 ± 7.7 mg/g for R2* analysis, p<0.0001. There was a curvilinear relationship between R2* and Ferriscan LIC estimates, given LICR2* = 1.5 (LICFerr)0.8, with a r2 value of 0.90 (p< 0.0001, Figure 1). On Bland-Altman analysis, the difference between Ferriscan and R2* LIC values increased with iron burden (r2 = 0.19, p=0.0002). Ferriscan was systematically 10.2% ± 27.8 % higher than R2* measurements (p<0.004), having 95% confidence intervals of [−45% – 65%], (Figure 2).
Both R2 and R2* are validated, clinically accepted tools for noninvasive LIC estimation, however they may produce disparate results in any given patient. In the present study, there are two known sources that account for systematic deviation among subjects. First, the liver R2 calibration curve was based on paraffin-embedded specimens compared with fresh specimens used for the liver R2* calibration curve. Analysis of paraffin embedded biopsies is known to artifactually increase dry weight liver iron concentration through the loss of lipophillic tissue solids during sample dewaxing; an effect size of 23% was reported by Butensky et al. The second source of error is the systematic underestimation of R2* (and their iron estimates) at high iron levels by gradient echo imaging; depending on the minimum echo time used at each site, values greater than 25–30 mg/g dry weight may have been underestimated. The 10% bias remains if one confines the Bland-Altman comparison to Ferriscan LIC values < 25 mg/g, but the upward trend in bias is abrogated. Observed variability between the Ferriscan and R2* measurements was comparable to results obtained by Wood et al in 2005 [− 43% – 66%]. This variability is not due to spatial fluctuations in iron concentration but rather upon discrepancies in microscopic iron particle size and distribution (Ghugre et al, 2010). In essence, each patient has a unique magnetic micro-mileau that creates intersubject differences between observed R2, R2* and tissue iron concentration. In summary, systematic biases exist between Ferriscan and liver R2* LIC values because they are calibrated to different standards (fresh versus paraffin-embedded tissue) and because current liver R2* protocols have more limited dynamic range for iron burden. Random variability in the two estimates is predominantly caused by the indirect relationship between magnetic properties and tissue iron rather than deficiencies in image acquisition and processing.
Wood:Novartis: Research Funding; Ferrokin Biosciences: Consultancy; Cooleys Anemia Foundation: Honoraria, Membership on an entity's Board of Directors or advisory committees, Research Funding. Jones:Ferrokin BioSciences: Employment. Rienhoff:Ferrokin BioSciences: Employment, Equity Ownership. Neufeld:Ferrokin BioSciences: Research Funding; Novartis: Research Funding.
Author notes
Asterisk with author names denotes non-ASH members.


This feature is available to Subscribers Only
Sign In or Create an Account Close Modal