Abstract 1395

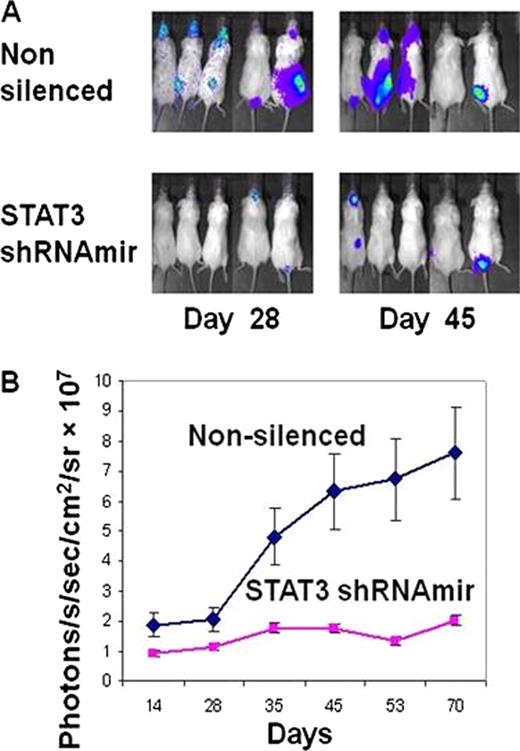
We have previously shown that constitutive activation of the signal transducer and activator of transcription (STAT) 3 protein is associated with worse outcome in patients with acute myeloid leukemia (AML). To clarify the role of STAT3 signaling in AML leukemogenesis, STAT3 shRNAmirs were introduced into the AML cell line HEL that carries the Janus kinase 2 with V617F mutation leading to constitutive tyrosine phosphorylation and activation of STAT3 and STAT5. Clonal line of HEL cells expressing STAT3 shRNAmir or control shRNA were generated and then transduced with a lentiviral virus harboring a constitutively expressed firefly luciferase gene. Engraftment of these cells was evaluated in a disseminated xenograft non-obese diabetic severe immunocompromised mouse model. When tested in vitro, HEL STAT3 knock-down (HEL-STAT3KD) cells showed normal STAT5 expression and activity but had lower proliferation rates than control cells, PKC-bII and Pim1 were down-regulated, and activation of ERK1/2 was increased. Trans-signaling by hyper-IL-6 enhanced STAT3 phosphorylation proportional to STAT3 level. In vivo imaging of luciferase activity demonstrated significant delay in engraftment of STAT3KD cells compared with controls (Figure). To the best of our knowledge, this is the first demonstration that STAT3 knockdown delays leukemia cell engraftment, that STAT3 signaling is crucial for AML leukemogenesis and should promote STAT3-tailored therapeutic targeting.
Figure:

Down-regulating STAT3 results in delayed HEL engraftment. Panel 1A, Optical CCD images of HEL (non-silenced control in the upper panel and shRNAmir in the lower panel) xenografts in NOD/SCID mice from day 28 and day 45. Panel 1B, Graphs showing correlation of luciferase gene expression in HEL xenografts (p=0.0079, Man-Whitney test). The graphs were generated from repeated scanning of the mice on days 14, 28, 35, 45, 53 and 72. Individual mean values (photons/s/cm2/sr) calculated from the regions of interest were plotted.

Close modal
Disclosures:

No relevant conflicts of interest to declare.

Author notes

*

Asterisk with author names denotes non-ASH members.

Sign in via your Institution