Abstract
Abstract 3599
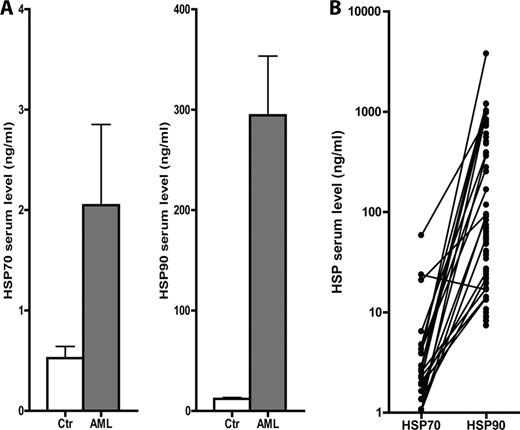
Heat shock proteins (HSPs) maintain cellular homeostasis and function as molecular chaperones assisting protein folding and translocation. Their intracellular levels are up-regulated in response to a wide variety of insults allowing the cell to survive otherwise lethal conditions. Heat shock proteins are also released to the extracellular space and lead to a more efficient cross-presentation to specific T cells and may also initiate release of proinflammatory cytokines, stimulate NK cells and facilitate DC maturation. Extracellular Heat shock protein (HSP) 70 and HSP90 are characteristics of immunogenic apoptosis, and primary human acute myeloid leukemia (AML) cells release these mediators during spontaneous in vitro apoptosis. Primary AML cells also show constitutive release of several cytokines; these heterogeneous mediators interact through local cytokine networks that regulate growth and differentiation of normal as well as malignant hematopoietic cells. In the present study we investigated serum levels of HSP70/HSP90 and the serum cytokine profiles of patients with untreated AML and patients receiving disease-stabilizing treatment based on all-trans retinoic acid (ATRA) plus valproic acid.
Serum samples from 82 untreated AML patients, including 42 patients receiving AML-stabilizing therapy, and 20 healthy controls were analysed. HSP and cytokine levels were determined by ELISA and multiplex analyses.
AML patients showed an altered serum cytokine profile compared to healthy controls with significantly altered levels of several chemokines, interleukins, growth factors and immunomodulatory cytokines (Tab.1). These cytokine levels were usually increased compared to the healthy controls. Hierarchical cluster analysis of the untreated patients showed a close association between HSP70, HSP90 and Hepatocyte growth factor (HGF) levels, these mediators also showed a significant correlation (Spearman, p<0.01). Furthermore, disease-stabilizing therapy altered the serum cytokine profile, but the profiles differed when ATRA + valproic acid was combined with either theophyllin or low-dose cytarabine. The close association between HSP70, HSP90 and HGF levels was then maintained only in the cytarabine group.
| Cytokine . | . | Patients . | Controls . | P-value . |
|---|---|---|---|---|
| IMMUNOMODULATORY CYTOKINES | ||||
| TNF-α | ↑ | 8.4 (<1.5–68.5) | 4.5 (2.3–13.4) | 0.016 |
| INTERLEUKINS | ||||
| IL-1α | ↓ | 0.5 (<0.4–7.0) | 2.0 (2.0–2.9) | <0.0001 |
| IL-4 | ↓ | <4.5 (<4.5–53.9) | 11.8 (5–17.5) | <0.0001 |
| IL-5 | ↑ | <0.7 (<0.7–39.1) | 0.9 (<0.7–0.9) | 0.0001 |
| IL-6 | ↑ | 5.8 (<1.1–204.6) | <1.1 (<1.1–7.7) | <0.0001 |
| IL-10 | ↑ | 1.3 (<0.3–238.0) | 0.3 (<0.3–0.8) | 0.0005 |
| CHEMOKINES | ||||
| CXCL5 | ↓ | 128.4 (<4.1–3252) | 1283.5 (341–5307) | <0.0001 |
| CXCL8/IL-8 | ↑ | 30.5 (<2.0–1103) | 10.7 (2.2–22.8) | 0.0003 |
| CXCL10 | ↑ | 56.7 (0.5–1958) | 15.25 (8.5–58.4) | <0.0001 |
| GROWTH FACTORS | ||||
| HGF | ↑ | 797.3 (1–9703) | 262.4 (117.3–729.3) | <0.0001 |
| GM-CSF | ↑ | 0.5 (<2.0–17.2) | 0.9 (0.9–3.6) | 0.0096 |
We conclude that both HSP levels and serum cytokine profiles are altered in untreated AML, and the modulation of these serum levels by AML-stabilizing chemotherapy may reflect a possible mechanism for the clinical effect of this treatment strategy.
The table shows serum levels for 82 AML patients and 20 healthy controls where significant differences were found (Mann-Whitney U-test, p<0.02). The results are presented as the cytokine analyzed, the alteration in the patients (↑ increased, ↓ decreased), levels in patients and healthy controls (median and range). All cytokine concentrations are presented as pg/ml, for cytokine levels not detected the values are set to < the detection limit.
No relevant conflicts of interest to declare.
Author notes
Asterisk with author names denotes non-ASH members.


This feature is available to Subscribers Only
Sign In or Create an Account Close Modal