Abstract
Abstract 1093
Idiopathic thrombotic thrombocytopenic purpura (TTP) is a rare, clinically-diagnosed disorder characterized by widespread intravascular platelet thrombosis. The pathophysiology involves acquired deficiency of ADAMTS13 (A disintegrin and metalloprotease with thrombospondin type 1 repeats), the enzyme responsible for cleavage of high molecular weight vonWillebrand factor multimers. Disease mortality is high, though prompt treatment with plasma exchange is generally effective. A readily available and highly reliable method of identifying ADAMTS13-deficient patients for appropriate plasma exchange is therefore of interest.
Our initial study (Bentley et al, Transfusion 2010;50:1654–1664) involved the assessment of multiple clinical and laboratory variables in patients with clinically-suspected TTP for whom ADAMTS13 assay was performed. Five variables were found to be of significant predictive power. This enabled the development of a point-based scoring system to efficiently determine the likelihood of TTP and response to plasma exchange in a given patient. (seeTable 1). This current study involved a separate validation cohort of patients with clinically-suspected TTP who underwent ADAMTS13 testing within two large health care systems in Utah between 2009 and 2011. The previously derived score was applied to this cohort and its performance was analyzed. Additionally, the original and validation cohorts were combined to revisit the predictive power of individual variables, derive more parsimonious models, and refine diagnostic scores.
A total of 96 patients comprised the validation population. The percentage of TTP diagnoses in this group (10%) was identical to that in the initial cohort. Using an ADAMTS13 activity of <10% of normal, our original score correctly predicted or excluded TTP in all but one patient when data for all variables was available. The mis-predicted patient was a “false positive;” or, in other words, our score predicted TTP, when in fact this patient's ADAMTS13 activity was not low, and the ultimate diagnosis was HUS. On closer review, this patient was a child whose creatininevalue, though within the normal range for an adult, was indicative of significant renal insufficiency in a pediatric patient. Our score did not inappropriately exclude the diagnosis of TTP in any patient with ADAMTS13 <10% of normal. However, in cases with one or more predictive variables missing, it performed less well.
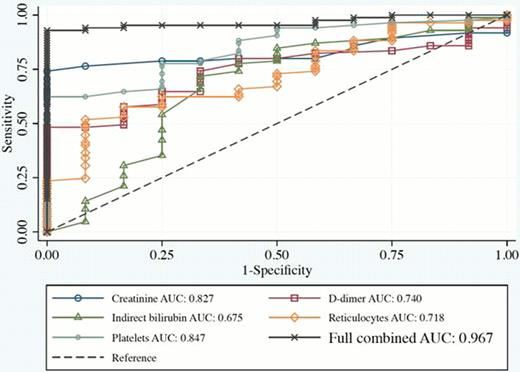
In combined analysis, four of the five originally derived predictive variables remained highly significant: platelets (p=0.004), reticulocytes (p=0.009), d-dimer (p=0.027), and creatinine (p=0.005); the fifth, indirect bilirubin, was not statistically significant as a single variable (p=0.128). However, in creating a parsimonious model using only two variables, the most predictive power comes from platelet counts and indirect bilirubin. ROC analysis of individual, combined, and parsimonious models was performed (Figure 1).
This work confirms the predictive power of a simple point-based score to exclude TTP in appropriately selected patients. It may enable clinicians to begin plasma exchange, or to pursue an alternative cause of thrombotic microangiopathyand subsequently to begin prompt and appropriate treatment.
Clinical prediction score.*
| Variable . | Assigned points . | Total Score by Model . | Probability of TTP . |
|---|---|---|---|
| Creatinine >2.0 mg/dl | −11.5 | <20 points | 0% |
| Platelets >35 K/ul | −30 | 20–30 points | 40% |
| D-dimer >4.0 μg/ml | −10 | >30 points | 100% |
| Reticulocyte >3% | 21 | ||
| Indirect Bilirubin >1.5 mg/dl | 20.5 |
The probability of TTP could be estimated by summing results of individual predictor variable point scores.
ROC curve showing sensitivity and 1-specificity values for each of the predictor variables and for the full model.
ROC curve showing sensitivity and 1-specificity values for each of the predictor variables and for the full model.
No relevant conflicts of interest to declare.
Author notes
Asterisk with author names denotes non-ASH members.


This feature is available to Subscribers Only
Sign In or Create an Account Close Modal