Abstract
Abstract 4239
In order to evaluate the evolution of therapies used in randomized controlled trials (RCTs), these treatments can be viewed as a treatment network. Using SNA allows us to examine the relationships and importance among different treatments in the network. Currently, there is no standard treatment regimen for patients with relapsed or refractory MM. Furthermore, the lack of a directed research agenda among RCTs of salvage therapy makes it difficult to produce evidence-based treatment guidelines. Our goal is to analyze the research network of RCTs studying salvage therapies among patients with MM using SNA which is anticipated to assist in directing future research.
MEDLINE (PubMed), abstracts from the American Society of Hematology and American Society of Clinical Oncology were searched to July 2012 to identify all phase III RCTs of salvage therapy among patients with MM. Data on treatments used for the experimental and standard arm and sample size were extracted. A treatment network was created from the treatments in the included RCTs. The analysis included calculation of the following SNA measures: constraint, size, 2StepReach, and degree. Data were analyzed with UCINET 6 and figures were created with NetDraw 2.119.
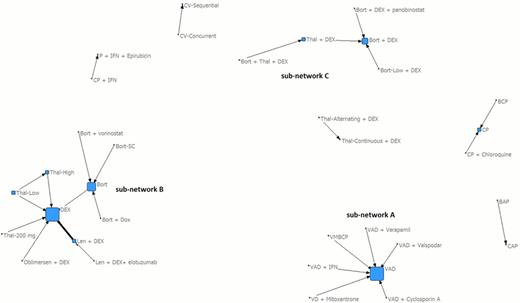
Twenty-six RCTs enrolling a total of 6627 patients were included. The majority (54%) of the trials enrolled less than 150 patients. The treatment network (Figure) is fragmented with 3 prominent sub-networks and 5 isolates with 2 to 3 treatments. This fragmentation indicates that there is no communication among these sub-networks and isolates. Sub-network A is created around VAD treatment and is mostly of historical importance. Sub-network B is created between treatments compared to single agent Bort or DEX and sub-network C on treatments compared to combination Bort-DEX. Sub-network C contains the only head-to-head comparisons of novel agents (Thal versus Bort and Bort plus Thal versus Thal). The metrics for the treatments contained in sub-networks B and C are shown in the Table. Bort, DEX, and combination Bort-DEX have low constraint values indicating ample experimentation between treatments within their respective sub-networks. In contrast, Thal-Low and Thal-high have high values of constraint indicating that these treatments are rather isolated from the rest of their sub-network. Single agent DEX and Bort have the largest networks (6 and 4 nodes respectively) since they were most often used as standard treatment. This can also be seen in the Figure where the nodes for DEX and Bort are much larger compared to the other nodes in their network. This is further confirmed by the 2StepReach analysis where single agent DEX and Bort are able to reach the largest number of nodes within two “steps” compared to other treatments within their network.
The geometry of the treatment network demonstrates the fragmented and unorganized evolution of salvage therapies in MM. Most recently single agent Bort and DEX and combination Bort-DEX have been used most frequently as the standard comparison in RCTs. However, there were only two head-to-head comparisons of novel agents (Thal versus Bort and Bort plus Thal versus Thal). Using SNA can aid researchers in developing a more focused research agenda which will facilitate the development of evidence-based guidelines for salvage therapy among patients with MM.
Salvage Therapy Network by Degree. The line thickness indicates the number of times two treatments were compared.
Salvage Therapy Network by Degree. The line thickness indicates the number of times two treatments were compared.
Metrics for Salvage Therapy Network
| Treatment1 . | Constraint . | Size . | 2StepReach . |
|---|---|---|---|
| Bort | 0.250 | 4 | 27.27 |
| DEX | 0.235 | 6 | 30.30 |
| Len + DEX | 0.556 | 2 | 21.21 |
| Oblimersen + DEX | 1.000 | 1 | 18.18 |
| Bort + Dox | 1.000 | 1 | 12.12 |
| Thal-Low | 1.125 | 2 | 18.18 |
| Thal-High | 1.125 | 2 | 18.18 |
| Thal-200 mg | 1.000 | 1 | 18.18 |
| Bort-Low + DEX | 1.000 | 1 | 9.09 |
| Bort + DEX | 0.333 | 3 | 12.12 |
| Bort + Thal + DEX | 1.000 | 1 | 6.06 |
| Thal + DEX | 0.500 | 2 | 12.12 |
| Len + DEX + elotuzumab | 1.000 | 1 | 6.06 |
| Bort + vorinostat | 1.000 | 1 | 12.12 |
| Bort + DEX + panobinostat | 1.000 | 1 | 9.09 |
Abbreviations-Bort: bortezomib; DEX: dexamethasone; Len: lenalidomide; Dox: doxorubicin; Thal: thalidomide
No relevant conflicts of interest to declare.
Author notes
Asterisk with author names denotes non-ASH members.


This feature is available to Subscribers Only
Sign In or Create an Account Close Modal