Abstract
Abstract 4375
The use of Fresh Frozen Plasma (FFP) has increased considerably in recent years. In the USA there was 70% increase in the use of plasma in 10 years between 1991 and 2001. Around 3.9 million units were transfused in 2001 and 5.7 million units in 2009. FFP is often used inappropriately globally and studies evaluating FFP use in the US are scarce. We conducted a study to assess the trends of FFP use, its implications, appropriateness, and impact of FFP on International Normalized Ratio (INR) in hospitalized adult medical patients with an elevated INR.
The study was a retrospective audit of all adult medical in-patients with an INR of 1.2 or higher who received FFP during a 3 month period from December 1, 2011 to February 28, 2012 admitted to Abington Memorial Hospital. A list of all patients who received FFP during the study period was obtained from the blood bank. Patients with major trauma, surgical, post-op, pediatric and obstetric/gynecological patients were excluded. Data was collected on demographics, indications of FFP, pre and post transfusion INR and effect of FFP on pre-transfusion INR. Partial thromboplastin time values (PTT) were not collected.
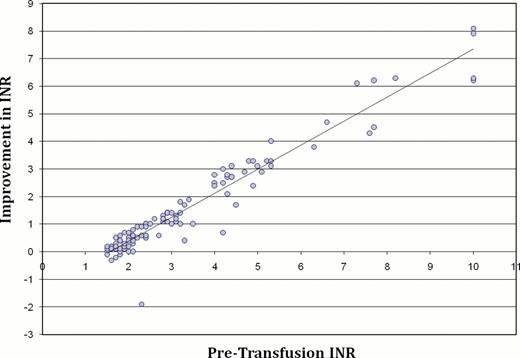
A total of 479 units of FFP were transfused to 97 patients over 114 transfusion episodes. Of the 97 patients, 51 were male (52.6%) and 46 were female (47.3%) with a mean age of 70.4 yrs (median 73 yrs, range 19–95 yrs). Of the total 479 units of FFP, 233 units (48.6%) were given to patients who were not actively bleeding (n=53) with a mean pre-transfusion INR (pre-INR) of 2.82 (range 1.5 to >10, SD 1.6). Warfarin related coagulopathy was noted in 65 patients (67%) and 340 units of FFP (71%) were transfused to these patients. FFP units transfused as pre-procedural prophylaxis were 176 out of 479 (36.7%). Twenty transfusion episodes amounting to 53 units of FFP (11.1%) were given to patients who were not actively bleeding and had a pre-INR of <2. Six patients did not get the planned procedure done and received 25 units (5.2%) of FFP. Of 15 patients who received FFP as pre-procedure prophylaxis with INR <2, only one (6.6%) had normalized post-transfusion INR (post-INR), 5 (33.3%) had post-INR of <1.5 and none had any bleeding complications. Inappropriate use of FFP in this study was noted to be 23.7% (114/479 units of FFP). Mean improvement in INR per unit of FFP for all transfusion episodes (n=114) was 0.36, with mean pre-INR of 3.28 (range 1.5 to >10) and mean post-INR of 1.72 (range 1.2 to 4.2). Mean improvement in INR/FFP in patients with pre-INR <2 vs. those with pre-INR 2 or higher was 0.22 vs. 0.42 respectively (p=0.021). Mean improvement in INR/FFP was significantly higher in patients with warfarin related coagulopathy vs. in those secondary to other causes (0.46 vs. 0.33, p=0.001). Patients who received vitamin K concurrently with FFP had higher mean improvement in INR/FFP than those who did not receive vitamin K (0.45 vs. 0.17, p=0.001). It was also noted that timing of post-INR check was very heterogeneous. Two patients developed an allergic reaction needing stoppage of transfusion and further treatment. Approximately $6,840 were wasted in direct costs ($60 per unit) in just 3 months for only medical in-patients excluding indirect costs (estimated at $100 per unit= $11,400) such as technician, nursing time; transfusion sets, pre-medication, etc.
Inappropriate use of FFP remains high even among medical in-patients. This study is consistent with previous studies in finding warfarin reversal as the major indication of FFP use and higher the pre-INR, higher was the improvement in INR. Especially, high percentage of use of FFP for pre-procedural prophylaxis with mild elevation of INR is alarming; therefore, studies evaluating restrictive vs. liberal use of FFP are needed.
Mean improvement in INR/FFP in various subsets of patients
| Variable . | Mean Improvement in INR/FFP . | 95 % Confidence interval for Mean . | P value . |
|---|---|---|---|
| INR < 2 | 0.22 | 0.07–0.37 | 0.021 |
| INR ≥ 2 | 0.42 | 0.33–0.52 | |
| Warfarin coagulopathy | 0.46 | 0.35–0.57 | 0.001 |
| Coagulopathy sec to others | 0.17 | 0.06–0.27 | |
| FFP + Vitamin K | 0.45 | 0.37–0.56 | 0.001 |
| FFP Only | 0.17 | 0.09–0.24 |
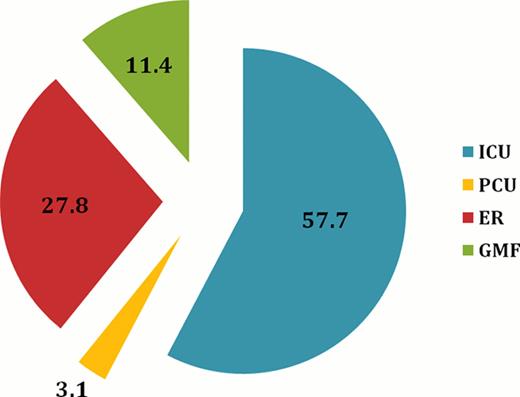
*ICU=Intensive care unit, PCU= Progressive care unit, ER= Emergency room, GMF= General medical floor.
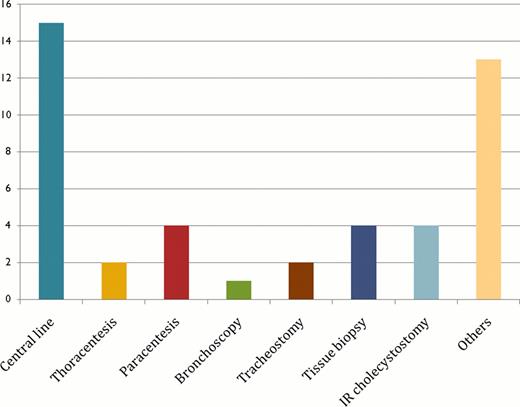
Frequency of Various Planned Procedures in Patients Needing FFP Transfusion
No relevant conflicts of interest to declare.
Author notes
Asterisk with author names denotes non-ASH members.


This feature is available to Subscribers Only
Sign In or Create an Account Close Modal