Abstract
Abstract 5098
Follicular Lymphoma (FL) comprises of 20–30% of Non-Hodgkin's Lymphomas. It is the most common lymphoma with varied clinical aggressiveness, depending on morphological grading on histology. The prognosis of FL is heterogeneous. Therefore therapeutic options for FL are increasingly becoming more risk-adopted. Pathologically, FL has been graded into grade 1–2 (FL1–2) and grade 3 (FL3) by visual counting or estimating the absolute number of centroblasts in neoplastic follicles. Recent studies found that the average tumor cell size of FL is highly variable, but is consistently reproducible, achieved by an objective measurement using flow cytometry. A significant variation in metabolic activity has also been observed in FL studied by PET scan. The purpose of this study was to investigate a new risk stratification method for FL using a combined criterion of Flow cytometry based cell size of FL cells and metabolic activity based on FDG PET scan to further evaluate their prognostic values.
Retrospective study of 64 patients (25 males and 39 females with median age of 61 years), diagnosed with FL between 2006 –2010 in Beaumont Health System with proper HIC approval was performed. 44 cases were graded morphologically into low risk (FL 1–2) and 20 into high risk (FL 3), based on current WHO classification. The average tumor cell size was measured based flow cytometric analysis of the relative forward scatters (FSC) of tumor cells relative to that of internal T-cells in the lymphoma tissue. The metabolic activity was measured as in maximal standardized uptake value (SUV max) of the involved lymph node by PET scan based F-18 FDG uptake. The SUV was normalized to a glucose level of 100 using the formula: SUV100={[100 mg/dl]/[glc]}g where g=[-0. 5] from our prior publication and [Glc] was the glucose level of the patient recorded at the time of PET scan. The difference of average lymphoma cell size between grade 1–2 (FL 1–2, indolent) and grade 3 (FL 3, aggressive) was compared with Student t test. The difference of size distribution between FL with low SUV100 and FL with high SUV100 were compared with Chi square and Kappa tests. A two-tail p-value less than 0. 05 was considered significant in all tests. FSC and Metabolic activity were cross tabbed and correlated using cut off values determined by discriminant analysis.
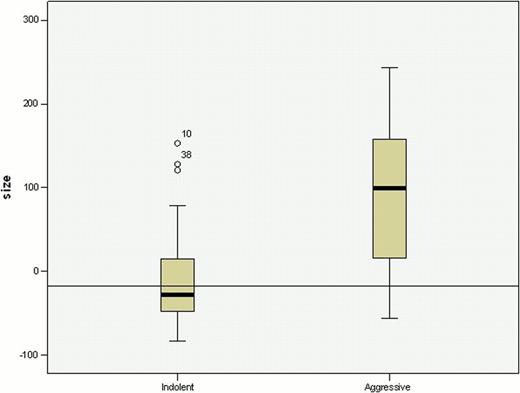
The FSC of B-cells were significantly lower in low grade FL than that in high grade FL (p=0. 00002). In contrast, FSC of residual T-cells in low grade FL and high grade FL were about the same (p=0. 2). Average lymphoma cell size of the low risk group (relative FSC of −15, range of −83 to 153) was significantly smaller than that of high risk group(relative FSC of 92, range of −32 to 243), (P<0. 0005)(figure 1). Using a cut off value FSC= −18 from discriminant analysis, and group them into aggressive and indolent FL, there was significant difference in metabolic activity (SUV 100) between the lymphoma with small and large tumor cell sizes (p=0. 021, by Chi-Square test)(figure 2). Combining these two objective independent measurements could accurately place low risk FL into observation with 95% confidence.
The significance of average lymphoma cell size identified by FSC in this study between FL grade 3 and grade 1–2 validate potential utility of flow cytometry in grading FL in refining the grading because the measurement of average lymphoma cell size by flow cytometry it is more reproducible, objective, and easy to use than manual counting centroblasts microscopically. Since increased metabolic activity is often associated with more aggressive clinical behavior, combining tumor cell size by flow cytometry and metabolic activity by FDG PET imaging can potentially serve as an independent criterion in risk stratification and better grading of FL. Further clinical correlation is in progress.
No relevant conflicts of interest to declare.
Author notes
Asterisk with author names denotes non-ASH members.


This feature is available to Subscribers Only
Sign In or Create an Account Close Modal