Abstract
Abstract 699
MDS is a disease of the elderly. While comorbidity defined by the MDS comorbidity index (MDS-CI) may have independent impact on overall survival in MDS (Della Porta MG., Haematologica 2011), the impact of clinical frailty (an age-related vulnerability state created by loss of physiologic reserve) on clinical outcome and quality of life is not yet known. Rockwood and colleagues have developed a simple 9-point clinical frailty scale (CFS) based on clinical judgment that was highly correlated with the risk of death, institutionalization, worsening health and hospital use (Rockwood K., CMAJ 2005). Since 2008, we have prospectively assessed QOL in all patients registered at our MDS clinic using the instruments EORTC QLQ-C30, FACIT-F, and EQ-5D. Since January 2012, we have also recorded comorbidity and frailty. We present longitudinal QOL data on 240 patients and evaluate the effects of comorbidity (MDS-CI) and frailty (CFS) on QOL in addition to the more traditional covariates.
We considered the following co-variates' potential impact on QOL scores: age, sex, IPSS, time from diagnosis, hemoglobin, transfusion dependence, MDS-CI categorically and frailty. We used univariate and multivariate linear regression analysis to determine their relationship with QOL scores at baseline and over time. For time-dependent covariates, linear mixed modelling was used. P value of <0.05 was considered significant. Spearman correlation was calculated between frailty and comorbidity. Clinically significant (CS) score differences were considered 10 points for the EORTC, 0.08 for EQ5-D and 4 for the FACT-Fatigue. Patients provided informed consent for this REB-approved study.
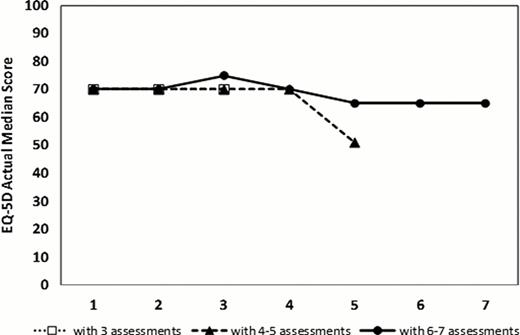
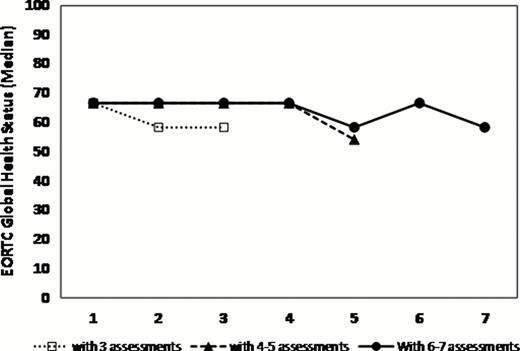
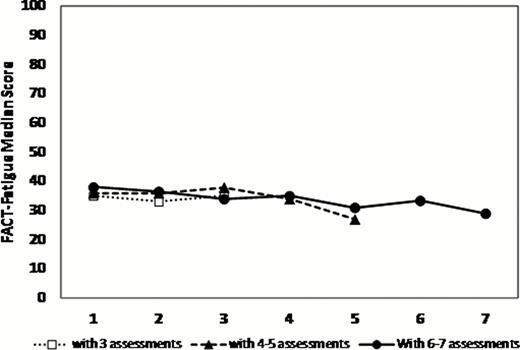
236 patients (63% males) consented at a median time from diagnosis of 0.8 years (IQR 0.4–2.8). The median time to death or last follow-up was 2 years (95% CI 1.9–2.3). At first QOL assessment, the median age was 72 y. Of the 208 patients with measurable IPSS scores, 83% fell into low/low intermediate risk categories. 40% were transfusion dependent, 46% had a Hgb of <100 g/L and 31% had a ferritin >1000 ug/L. Serial QOLs were measured on 2 (n=187 patients), 3 (140), 4 (114), 5 (86), and 6 (63) occasions with a median lag time between QOLs of 17 weeks (IQR 12–26). The MDS-CI risk categories (scores) were Low (0): 46%, Intermediate (1–2): 41% and High (>2): 12%. The median Rockwood Frailty Score was 3 (range: 1–7). Compared to normative data from the general population, MDS patients had SS and CS differences in the following QLQ-C30 scales: worse physical, role, emotional and cognitive functioning, and worse fatigue and global health status. MDS-CI categories were weakly correlated with frailty (r= 0.25, p=.02). As we have previously shown, at baseline, transfusion dependence had significant negative impact on global health state (p=.0036), EQ-5D (p=.0001) and fatigue (p=.0051) scores and lower hemoglobin had negative impacts on fatigue (p=.01) and dyspnea (p<.0001). Patients with higher frailty scores had significantly worse fatigue (p=.001). Most QOL domains and global QOL scores remained stable over time (figure 1). When examined for significant changes over time, lower frailty scores were independently predictive of improved global health status and health utility (p< .0001) while patients with lower comorbidities had decreased levels of fatigue (p=.04) and dyspnea (p=.02) (Table 1).
MDS health-related quality of life scores remain surprisingly stable over time. While transfusion dependence is still highly impactful, frailty and comorbidity are independent variables that should be routinely evaluated for their predictive effects on quality of life, drug toxicity and overall survival.
Selective HrQOLs by CFS and MDS-CI risk categories
| . | Frailty 1 . | Frailty 2 . | Frailty 3 . | Frailty 4 . | Frailty 5 . | Frailty 6 . | Frailty 7 . | MDS-CI Low . | MDS-CI INT . | MDS-CI High . |
|---|---|---|---|---|---|---|---|---|---|---|
| EQ-5D | 72.5 | 80.0 | 70.0 | 60.0 | 57.5 | 45.0 | 67.5 | 77.5 | 70.0 | 70.0 |
| EORTC global health | 70.8 | 70.8 | 66.7 | 54.2 | 58.3 | 50.0 | 45.8 | 66.7 | 66.7 | 66.7 |
| EORTC dyspnea | 16.7 | 0 | 0 | 33.3 | 33.3 | 0 | 50.0 | 16.7 | 33.3 | 0 |
| FACT-F* | 43.0 | 43.0 | 34.5 | 28.0 | 37.4 | 30.5 | 25.5 | 39.0 | 33.5 | 30.0 |
Higher scores mean less fatigue
QOL scores over time assigning patients into 3 groups with variable numbers of serial QOL
QOL scores over time assigning patients into 3 groups with variable numbers of serial QOL
Buckstein:Celgene: Honoraria, Research Funding. Wells:Novartis: Honoraria, Research Funding; Celgene: Honoraria, Research Funding; Janssen Ortho: Honoraria, Research Funding; Alexion: Honoraria, Research Funding.
Author notes
Asterisk with author names denotes non-ASH members.


This feature is available to Subscribers Only
Sign In or Create an Account Close Modal