Abstract
Abstract  712
712
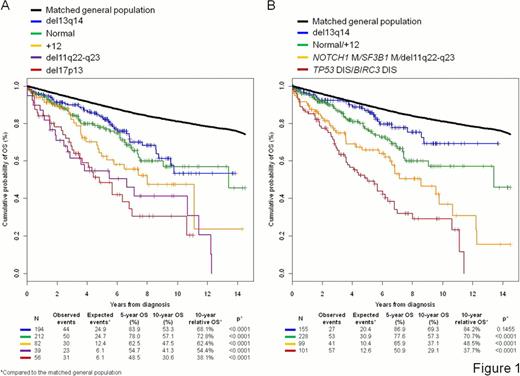
The identification of NOTCH1, SF3B1, MYD88 and BIRC3 genetic lesions in chronic lymphocytic leukemia (CLL) prompts a comprehensive and dynamic prognostic algorithm including gene mutations, chromosomal abnormalities, and their changes during clonal evolution. The study utilized both time-fixed (637 newly diagnosed CLL) and time-dependent (257 CLL provided with 524 sequential samples) approaches. Each sample was investigated for TP53, NOTCH1, SF3B1, MYD88, and BIRC3 mutations by Sanger sequencing and for 17p13, 11q22-q23, 13q14 and BIRC3 deletions and +12 by FISH. Del13q14 and +12 distributed in a mutually exclusive fashion (p<0.0001), and identified three main genetic subgroups: cases harboring del13q14, cases harboring +12 and cases lacking both del13q14 and +12. With the sole exception of the expected association between NOTCH1 mutations and +12 CLL (p=0.0014), the prevalence of the other genetic lesions did not differ among molecular subgroups. FISH abnormalities segregated patients in distinct prognostic groups according to Döhner (Fig 1A). Among new genetic lesions, survival analysis confirmed the independent prognostic value of NOTCH1, SF3B1 and BIRC3 lesions in this study cohort. MYD88 mutations had no prognostic effect (p=0.1728). Recursive partitioning analysis followed by random survival forest validation established the hierarchical order of relevance of the genetic lesions, and created an integrated mutational and cytogenetic (MUCY) model that classified newly diagnosed CLL into four prognostic subgroups (Fig 1B). High risk patients harbored TP53 disruption and/or BIRC3 disruption independent of co-occurring lesions (10-year survival: 29.1%). When the demographic effects of age, sex and year of diagnosis were compensated, the 10-year life expectancy of high risk patients was only 37.7% of that expected in the matched general population (p<0.0001). Intermediate risk patients harbored NOTCH1 and/or SF3B1 mutations and/or del11q22-q23 in the absence of TP53 and BIRC3 abnormalities (10-year OS: 37.1%). The 10-year life expectancy of intermediate risk patients was reduced to 48.5% compared to the matched general population (p<0.0001). The low risk category comprised both patients harboring +12 and patients wild type for all genetic lesions (i.e. normal) (10-year OS: 57.3%), with a 10-year life expectancy of 70.7% compared to the matched general population (p<0.0001). Very low risk patients harbored del13q14 as the sole genetic lesion (10-year OS: 69.3%), with a 10-year life expectancy only slightly (84.2%) and not significantly (p=0.1455) lower than that expected in the matched general population. Multivariate analysis selected the MUCY model as one of the most important independent risk factor of CLL OS (HR: 1.38; 95% CI: 1.18–1.60; p<0.0001; 99% bootstrap selection), along with age (HR: 1.06; 95% CI: 1.04–1.07; p<0.0001; 100% bootstrap selection), Rai stage (HR: 1.36; 95% CI: 1.23-1-51; p<0.0001; 100% bootstrap selection) and unmutated IGHV genes (HR: 1.63; 95% CI: 1.17–2.26; p=0.0039; 92% bootstrap selection). Overall, 21.5% (105/488) low risk patients according to the FISH model (del13q14, normal and +12) were reclassified into high risk genetic subgroups by the MUCY model because of the co-occurrence of NOTCH1 (64/488, 13.1%), SF3B1 (35/488, 7.1%), and TP53 (17/488, 3.4%) mutations or BIRC3 disruption (14/488, 2.8%). Consistently, the inclusion of NOTCH1, SF3B1 and BIRC3 lesions in addition to FISH abnormalities significantly improved the model accuracy of OS prediction (c-index: 0.617 vs c-index: 0.642 p<0.0001). At 10 years from diagnosis, 24.5% CLL of the very low and low risk genetic subgroups developed new TP53, NOTCH1, SF3B1, BIRC3 or del11q22-q23 lesions due to clonal evolution, and therefore switched to a higher risk category of the MUCY model. By time-dependent and landmark analysis, the MUCY model retained a statistically significant impact on CLL OS (HR: 1.52; 95% CI: 1.21–1.90; p=0.0003) at any time from diagnosis and independent of its dynamic changes due to clonal evolution. The MUCY model classifies CLL patients into more precise subgroups, advances our understanding of CLL biology, and improves current prognostic algorithms. These findings have relevant implications for the design of clinical trials aimed at assessing the use of mutational profiling to inform therapeutic decisions based on risk stratification.
No relevant conflicts of interest to declare.
Author notes
Asterisk with author names denotes non-ASH members.

This icon denotes a clinically relevant abstract


This feature is available to Subscribers Only
Sign In or Create an Account Close Modal