Abstract
We have previously shown that CD271+ MSC density is increased in MDS; that MDS MSCs overexpress a key chemokine, CXCL12; and that CD271+ MSCs are in direct contact with CD34+ progenitors (Lab Invest. 92:1330), suggesting an active role for CD271+ MSCs in MDS biology. Amid increasing evidence of a role for MSCs in the hematopoietic stem cell niche and in myeloid neoplasia, we present a retrospective study of CD271+ MSC density in diagnostic bone marrow core biopsies of cytopenic patients with and without MDS.
Tissue microarrays (TMAs) were constructed using duplicate 1mm cores of the bone marrow core biopsy. Immunohistochemistry with anti-CD271 was visualized in red against hematoxylin counterstain. A CD271 density scoring schema (CD271Score) was developed: 1, scattered; 2, loose or partial network; 3, prominent uniform network involving >75% of core. Automated quantitation of CD271 density as % hematoxylin+ marrow (CD271Quant) was performed on 40x photomicrographs using CellProfiler 2.0 (www.cellprofiler.org).
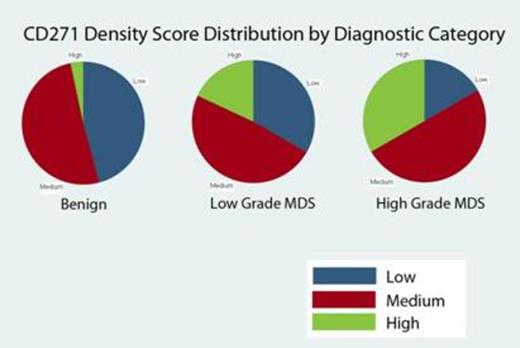
The patient population (Table 1) was divided into diagnostic categories of benign (B9, n=61), low grade MDS (LGMDS, <5% marrow blasts, n=40), and high grade MDS (HGMDS, ≥5% marrow blasts and/or therapy-related, n=24). CD271 density varied with diagnostic category (Figure 1, X2 = 10.6, p = 0.0051 for CD271Score; X2= 8.0, p = 0.018 for CD271Quant). High CD271 density was overrepresented in the HGMDS group; in two-way comparisons, B9 and LGMDS differ from HGMDS but not each other (B9 vs HGMDS, X2 = 10.1, p = 0.0015 for CD271Score and X2 = 7.7 p = 0.0056 for CD271Quant; LGMDS vs HGMDS X2 = 2.5, p = 0.11 for CD271Score and X2 = 5.4, p = 0.021 for CD271Quant). Among patients with MDS, CD271 density also correlated with poorer risk as assessed by IPSS-R (Spearman's rho = 0.32, p = 0.019 for CD271Score; Spearman's rho = 0.28 p = 0.037 for CD271Quant). CD271Score was reproducible (intraobserver kappa value 0.72, p < 0.0001) and correlated with CD271Quant (Spearman's rho = 0.68, p < 0.0001).
| . | Benign . | MDS . | p value1 . |
|---|---|---|---|
| . | n=61 . | n=64 . | . |
| Age | 67 (41–90) | 69.4 (35-89) | 0.15 |
| Gender (% Male) | 96.7 | 84.4 | 0.24 |
| Hg (g/dL) | 10.8 (6.3-15.7) | 10.6 (6.8-14.4) | 0.57 |
| ANC (K/uL) | 5.6 (0.2-91) | 2.1 (0.1-7.6) | 0.0001 |
| Platelets (K/uL) | 123 (14-417) | 123(6-541) | 0.60 |
| IPSS-R | n = 56 | ||
| % Very Low | 21.4 | ||
| % Low | 41.1 | ||
| % Intermediate | 14.3 | ||
| % High | 7.1 | ||
| % Very High | 16.1 |
Kruskall-Wallis test
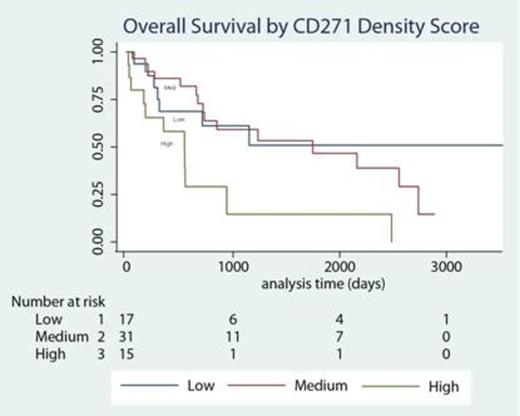
Regarding the impact on overall survival (OS), univariate Cox regression confirmed the expected predictive value of IPSS-R (p<0.001); red blood cell transfusion within 3 months prior to diagnosis (p<0.001); and therapy-related MDS subtype (trend, p = 0.11). Kaplan Meyer plots revealed shorter OS in the high CD271Score category (Figure 2) and in the upper quartile of CD271Quant. On univariate Cox analysis, normalized CD271Quant (p = 0.037) but not CD271Score was statistically significant. Much of the effect on OS appeared to be in the upper quartile of CD271 density (HR 3.0, p = 0.023 for highest versus lowest quartile of CD271Quant). In the multivariate Cox proportional hazards model, normalized CD271Quant remained statistically significant (p=0.027) together with IPSS-R (p<0.001) and transfusion requirement (p=0.001). Median follow-up of MDS patients OS was 21.4 months (range, 1 day to 115 months) with 34 deaths among 64 patients.
In the intact bone marrow core biopsy, a dense CD271+ MSC network, as assessed by two separate techniques (morphologic scoring by a pathologist or quantitation through automated image analysis), is associated with higher-risk diagnostic categories of MDS (refractory anemia with excess blasts, therapy-associated MDS) and with poor IPSS-R risk scores. Quantitative CD271+ MSC density is also associated with poorer OS, both on univariate analysis and in a Cox proportional hazards model including IPSS-R, transfusion, and therapy-related disease. Increased CD271+ MSC density may reflect an abnormal positive feedback loop between the myeloid clone and its dysfunctional mesenchymal niche.
No relevant conflicts of interest to declare.
Author notes
Asterisk with author names denotes non-ASH members.


This feature is available to Subscribers Only
Sign In or Create an Account Close Modal