Abstract
The International Staging System (ISS) is the current standard used for risk stratification of patients with newly diagnosed Multiple Myeloma (MM). Patients are stratified into three categories using the values of serum albumin and beta2-microglobulin (B2M). Recent studies have evaluated the relationship between serum free light chains (sFLC) at diagnosis and the prognosis of these patients. The aim of this study is to evaluate the prognostic value of sFLC ratio at baseline in newly diagnosed multiple myeloma (MM) in a Spanish population.
79 patients (35 Male : 44 Female) with a median age of 69 years (range 41-91) were recruited and followed for up to 5years. sFLC concentrations were measured nephelometrically (Freelite, The Binding Site, Birmingham, UK) and the sFLC ratio (sFLCr) was calculated using the monoclonal sFLC as the numerator. Patients were stratified into two groups according to the median value of sFLCR: group “low” with sFLCR <26 (39 patients) and group “high” with sFLCR >26 (40 patients). Clinical and laboratory variables (including Albumin, B2M, Creatinine, hemoglobin, calcium, LDH, M-protein size, plasma cell infiltration and presence of lytic bone lesions) were recorded and evaluated for their impact on patient's outcome. Statistical analysis were performed using (SPSS version 20.0) and significant variable were further analyzed by Cox Regression analysis.
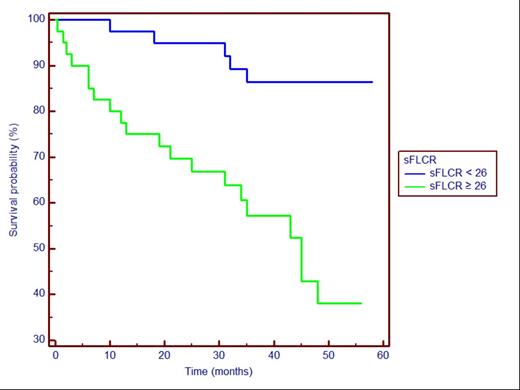
During follow-up there were 25 disease-related deaths: 5 in group “low” and 20 in group “high”. The 5-years OS of all patients was 63.7%, whereas it was 86.4% and 38.1% in groups “low” and “high” respectively (hazard ratio (HR): 5.51, p<0.0001) (Figure). Univariate analysis identified age>65 years old (OR: 3.61, p=0.030), creatinine>2 mg/dL (OR: 4.50, p=0.009), hemoglobin <10 g/dL (OR: 3.87, p=0.006), and ISS stage (p=0.001) as being significantly associated with adverse outcome. There was no significant correlation with the other variables. Multivariate Cox regression identified sFLCR (sFLCR>26, HR: 4.39, p=0.004) and B2M (B2M>3.5 mg/L, HR: 3.42, p=0.008) as independent risk factors for adverse outcome. A combination of ISS stage with high or low sFLCR to check correlation between sFLCR and OS (Table). The sFLCR separated every ISS stages in two subsets; one with low sFLCR and another with high sFLCR. Within ISS stage 2, the presence of high sFLCR was associated with a worse OS (p = 0.003). The OS was 86.5% versus 17.5% for the low and high sFLCR subsets, respectively. In stage 3, the OS of patients with high sFLCR was 0% while the OS of those with low sFLCR was 75%. In ISS stage 1, the two subsets defined by low and high sFLCR had a similar OS.
The sFLCR value at diagnosis is an important independent risk factor for poor prognosis in patients with newly diagnosed MM. Our results suggest that sFLCR should be included in the ISS System or a new risk model stratification in patients with newly diagnosed MM.
Prognostic value of International Stage System stratified by sFLCR. P-value within groups defined by low (sFLCR < 26) and high sFLCR (sFLCR ≥ 26).
| Risk group . | N . | Number of deceases n (%) . | Overall survival at 5 years (%) . | Median survival (months) . | Hazard ratio (95% CI) . | p-value . |
|---|---|---|---|---|---|---|
| ISS stage 1 | 30 | 3 (10%) | 89.4% | Not reatched | - | - |
| sFLCR < 26 | 19 | 2 (10%) | 89.2% | Not reatched | 1.00 (reference) | - |
| sFLCR ≥ 26 | 11 | 1(9%) | 90.9% | Not reatched | 1.03 (0.09-11.43) | 0.983 |
| ISS stage 2 | 31 | 11 (36%) | 56.6% | Not reatched | - | - |
| sFLCR < 26 | 16 | 2 (12%) | 86.5% | Not reatched | 1.00 (reference) | - |
| sFLCR ≥ 26 | 15 | 9 (60%) | 17.5% | 45 | 7.01 (2.09-23.52) | 0.003 |
| ISS stage 3 | 18 | 11 (61%) | 19.9% | 34 | - | - |
| sFLCR < 26 | 4 | 1 (26%) | 75.0% | Not reatched | 1.00 (reference) | - |
| sFLCR ≥ 26 | 14 | 10 (71%) | 0% | 34 | 4.89 (1.39-17.20) | 0.080 |
Figure. Overall survival according to “low” or “high” sFLC
Harding:Binding Site: Employment.
Author notes
Asterisk with author names denotes non-ASH members.


This feature is available to Subscribers Only
Sign In or Create an Account Close Modal