Abstract
In multiple myeloma (MM), translocations involving the immunoglobulin-heavy chain locus are characterized by transcriptional activation of the genes CCND1, CCND3, MAF, MAFB or FGFR3/MMSET. The translocation t(14:16)(q32;q23) results in high expression levels of the MAF gene (MAF-hi) and, conversely, high expression of the MAF gene can predict the presence of a t(14:16). The introduction of new drugs such as thalidomide and proteasome inhibitors has improved outcomes of most patients with MM. However, carriers of the translocation t(14:16) have not benefited from these agents.
We investigated whether constitutive genotypes influence risk of t(14:16) in MM patients. A genome-wide association scan was performed on leukapheresis products from 650 Caucasian MM patients using the Illumina HumanOmni1-Quad v1.0 BeadChip and for whom GEP data on CD138 selected plasma cells were available. Among these 650 patients, 30 belonged to the MAF-hi subgroup. A total of 796,509 SNPs were tested for association to high MAF expression levels (MM patients with low MAF expression levels (MAF-lo) served as a comparison group) using the Cochran-Armitage trend test. The genomic inflation factor based on median chi-squared was λ = 1.032, indicating that MAF-hi and MAF-lo patients were genetically well-matched.
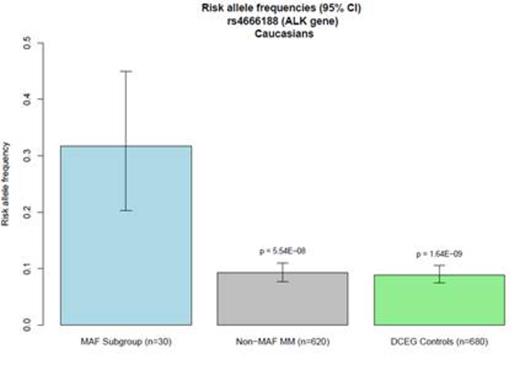
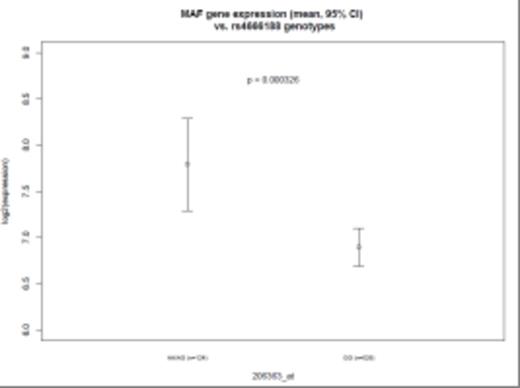
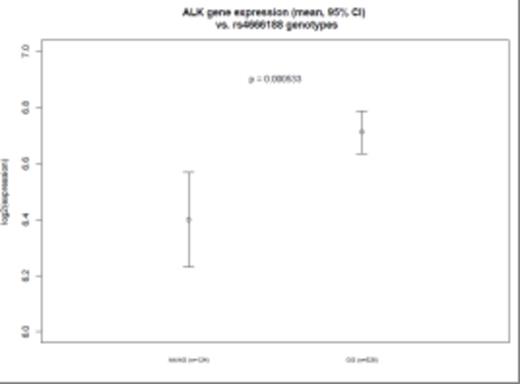
A single nucleotide polymorphism (SNP) (rs4666188, G/A) in the ALK (anaplastic lymphoma receptor tyrosine kinase) gene was significantly associated with high MAF expression levels (p = 5.54 × 10⁻⁸). Other SNPs in linkage disequilibrium with rs4666188 also showed a trend towards association with MAF-hi. We further examined the genotypes of the 30 MAF-hi patients in comparison to genotypes from 680 Caucasian cancer-free subjects from the Division of Cancer Epidemiology and Genetics (DCEG) Imputation Reference Set. We again found a significant association between rs4666188 and the MAF-hi patients (p = 1.64 × 10⁻⁹) compared with the non-cancer comparison group. Specifically, the minor allele frequency among MAF-hi MM patients was 0.32 compared to 0.09 in the MAF-lo group and 0.08 in non-cancer controls (Figure 1). Furthermore, among all 650 MM patients, the rs4666188 genotype variants of the ALK gene were significantly correlated to MAF gene expression levels. Homozygous wild-type G-allele carriers had lower expression of MAF compared to variant A-allele carriers (Figure 2A, p = 3.3 × 10⁻⁴). Finally, we addressed whether the genotype at rs4666188, located in the ALK gene, correlated to expression levels of the ALK gene. Homozygous wild-type G-allele carriers had a higher level of ALK expression as compared to heterozygous AG-allele and homozygous variant A-allele carriers (Figure 2B, p = 5.3 × 10⁻⁴).
MAF GEP levels and B:ALK GEP LEVELS according to ALK genotype(SNP:rs4666188)
We have identified a SNP (rs4666188) in the ALK gene which is significantly associated with the t(14:16)(q32;q23) translocation, as predicted by the GEP levels of the MAF gene. Carriers of the homozygous variant A-allele of the SNP rs4666188 in the ALK gene were at greater risk of high MAF gene expressions, with an allele frequency of 0.32 in high MAF GEP patients compared to 0.09 in low MAF GEP MM patients, which is similar to the allele frequency found in non-cancer controls of 0.08. The variant A-allele was significantly associated both with higher expression of the MAF gene and with lower expression of the ALK gene, hinting at a functional role for this inborn genetic variation in ALK. Thus, patients with this inborn variation have higher risk of carrying the t(14:16)(q32;q23) translocation predicted by GEP.
Figure 1. Minor allele frequency of SNP rs4666188 in the ALK gene. X-axis: MAF GEP-hi MM subgroup (blue); MAF GEP-lo MM subgroup (grey); non-cancer controls (green). Y-axis: The minor allele frequency for each group with corresponding p values as determined by Cochran-Armitage trend test.
Figure 2A: MAF GEP levels and B: ALK GEP levels according to genotype of the ALK gene (SNP: rs4666188) for all 650 Caucasian MM patients. X-axis: homozygous wild-type G-allele carriers (GG); heterozygous AG-allele carriers (AG) and homozygous variant A-allele carriers (AA). Y-axis shows the GEP levels and confidence intervals in log2 scale.
Barlogie:Celgene: Consultancy, Honoraria, Research Funding; Myeloma Health, LLC: Patents & Royalties.
Author notes
Asterisk with author names denotes non-ASH members.


This feature is available to Subscribers Only
Sign In or Create an Account Close Modal