Hodgkin lymphoma (HL) is mainly composed of reactive cells. Lymphocytes, macrophages, eosinophils, mast cells, plasma cells, and other stromal cells constitute these supportive or reactive cells. In-situ glycolytic and oxidative phosphorylation metabolism of reactive cells and cancer cells is unknown in HL. We interrogated HL specimens (N=24) to examine the metabolic compartments in-situ in this disease.
High glycolytic activity is seen in the majority of HL on the basis of high uptake of 2-[18] fluoro-2-deoxy-glucose (FDG) on positron emission tomography (PET). The advent of FDG-PET in HL has revealed that these tumors as a unit are glycolytic and staging and assessment of response to treatment has improved. However, it is unknown if cancer cells and reactive cells share a metabolic phenotype.
To study mitochondrial and glycolytic metabolism in HL cancer and reactive cells.
Two immunohistochemical biomarkers of metabolism were employed on HL tumor sections. Translocase of the Outer Mitochondrial Membrane 20 (TOMM20) protein expression is a biomarker of functional mitochondrial mass and oxidative phosphorylation. Monocarboxylate transporter 4 (MCT4) is a biomarker of glycolysis and lactate export. We selected 24 consecutive cases of classical HL based on morphology and immunohistochemical (IHC) staining for CD30, CD15 and CD45. We recorded FDG-PET standard uptake values (SUV) where available for all tumors studied. Immunohistochemical stains were performed on 5-micron thick, formalin-fixed, paraffin-embedded tissue sections using the horseradish peroxidase method. The primary antibodies used were TOMM20 and MCT4 (Santa Cruz). The immunostaining was graded on a scale of 0 to 2+ according to the intensity and percentage of immunoreactive cancer and reactive cells.
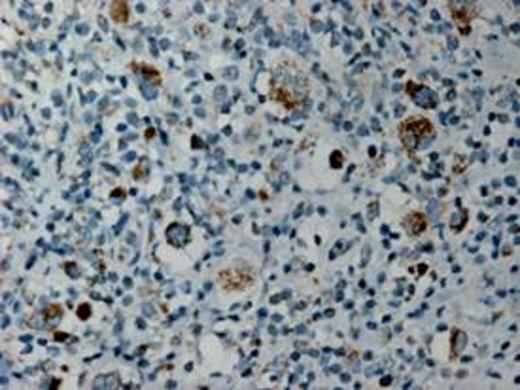
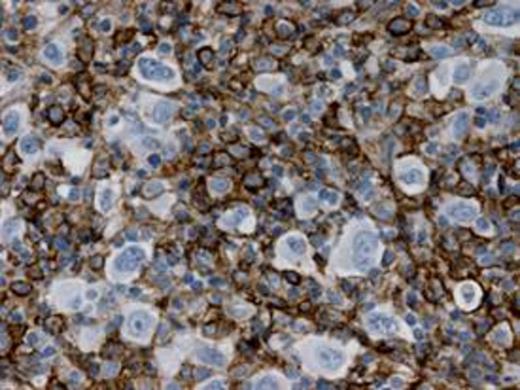
Reed Sternberg and Hodgkin cells (RS/H) had high TOMM20 expression and low MCT4. In fact, the highest TOMM20 expression out of all cells analyzed was found in the RS/H cells in 20 of the 24 samples. In the other 4 samples, cancer and reactive lymphocytes (RL) had similar expression of TOMM20. The tumor stroma or stromal cells in proximity to cancer cells which includes histiocytes (TS/H) had low TOMM20 expression and high MCT4 expression in all 24 samples analyzed. Higher than baseline FDG-PET uptake is a measure of glycolysis and was found in all tumors where FDG-PET was performed. High MCT4 expression was not found in normal stroma or stroma at a distance from cancer cells. Histiocytes always had low TOMM20 expression but MCT4 expression was high in proximity to cancer cells and low at a distance from cancer cells.
| Patient . | Stage . | IPI . | Max SUV . | . | TOMM20 . | . | . | MCT4 . | . | . |
|---|---|---|---|---|---|---|---|---|---|---|
| . | . | . | . | H/RS . | RL . | TS/H . | H/RS . | RL . | TS/H . | NS . |
| 1 | IVB | 4 | 20.9 | 1+ | 1+ | 0 | 0 | 0 | 2+ | 1+ |
| 2 | IIIB | 1 | 11.63 | 2+ | 1+ | 1+ | 0 | 0 | 2+ | 0 |
| 3 | IVB | 3 | 10.9 | 2+ | 1+ | 0 | 0 | 0 | 2+ | 0 |
| 4 | IIIA | 2 | 14.7 | 2+ | 1+ | 0 | 0 | 0 | 2+ | 0 |
| 5 | IIA | 3 | 23.16 | 2+ | 1+ | 0 | 0 | 0 | 1+ | 0 |
| 6 | IIA | 1 | 10.96 | 2+ | 1+ | 1+ | 0 | 0 | 2+ | 0 |
| 7 | IIA | 1 | 17.31 | 2+ | 1+ | 0 | 0 | 0 | 1+ | 0 |
| 8 | IVB | 4 | 15.87 | 2+ | 1+ | 0 | 0 | 0 | 2+ | 0 |
| 9 | IIB | 1 | 2.4 | 2+ | 1+ | 0 | 0 | 0 | 2+ | 0 |
| 10 | IIA | 3 | 19.27 | 1+ | 1+ | 0 | 0 | 0 | 2+ | 0 |
| 11 | IIB | 2 | 12.67 | 2+ | 1+ | 1+ | 0 | 0 | 2+ | 0 |
| 12 | IVB | 4 | 17.24 | 2+ | 1+ | 0 | 0 | 0 | 2+ | 0 |
| 13 | IIB | 1 | 14.19 | 2+ | 1+ | 0 | 0 | 0 | 2+ | 0 |
| 14 | * | * | * | 2+ | 1+ | 0 | 0 | 0 | 2+ | 0 |
| 15 | IVB | 4 | 12.6 | 2+ | 1+ | 0 | 0 | 0 | 2+ | 0 |
| 16 | * | * | * | 2+ | 1+ | 0 | 0 | 0 | 2+ | 0 |
| 17 | IIA | 1 | 3.45 | 2+ | 1+ | 0 | 0 | 0 | 1+ | 0 |
| 18 | IIB | 3 | 12.47 | 2+ | 1+ | 0 | 0 | 0 | 2+ | 0 |
| 19 | IIB | 1 | 13.47 | 2+ | 0 | 0 | 0 | 0 | 2+ | 0 |
| 20 | IIA | 1 | 16.8 | 2+ | 1+ | 0 | 0 | 0 | 2+ | 0 |
| 21 | IIIB | 3 | 8 | 2+ | 1+ | 0 | 1+ | 0 | 2+ | 0 |
| 22 | IIIA | 1 | 2.77 | 1+ | 1+ | 0 | 0 | 0 | 1+ | 0 |
| 23 | IIA | 1 | 7.04 | 1+ | 0 | 0 | 0 | 0 | 2+ | 1+ |
| 24 | IIB | 1 | 2.4 | 1+ | 0 | 1+ | 1+ | 0 | 2+ | 0 |
IPI – International prognostic index, SUV – standard uptake values, RS/H – Reed-Sternberg or Hodgkin cells, RL – reactive lymphocytes, TS/H – tumor-associated stroma and histiocytes, NS – normal reactive stroma
No follow-up after initial pathologic diagnosis
Glycolysis and lactate export occurs in cancer-associated stroma (TS/H) that is spatially linked to mitochondrial metabolism in cancer cells (RS/H) in HL. This suggests that the most FDG-PET avid cells within HL are the reactive cells and not the cancer cells. Also, normalization of FDG-PET uptake when assessing response to treatment suggests reversal to a metabolically normal stroma.
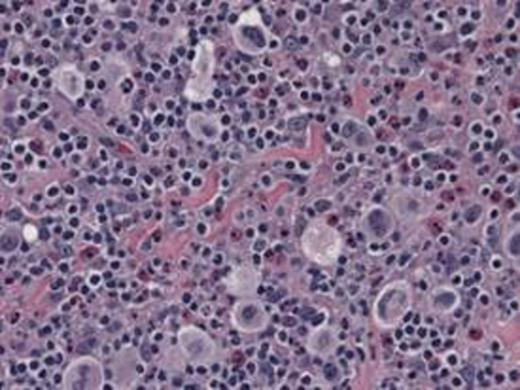
Representative images, 60x:
Hematoxylin & Eosin
TOMM20
No relevant conflicts of interest to declare.
Author notes
Asterisk with author names denotes non-ASH members.


This feature is available to Subscribers Only
Sign In or Create an Account Close Modal