The vascular alterations play an important role in the SCA chronic inflammatory state with the participation of different cell types, including macrophages and dendritic cells (DCs).
Here, we evaluated the mRNA expression of TLRs in DCs cells pre and post LPS stimulus and also measured IL-1β, TNF-α and IL-10 cytokines in plasma and supernatant of DCs pre and post LPS challenge, in order to indentify a possible role of this cell and receptor in the inflammatory state described in sickle cell anemia.
In vitro generation of immature DCs (imDC) monocyte-derived was obtained of monocytes from peripheral blood mononuclear cells (PBMC) of seven hospitalized HbSS patients. Relative mRNA abundance of each transcript was investigated by quantitative real time PCR and cytokines levels were measured by ELISA.
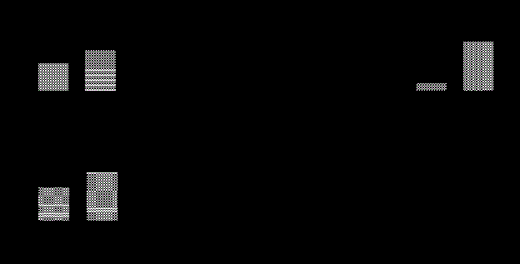
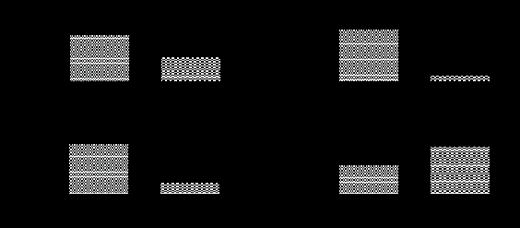
We found that different HbSS patients showed specific DCs TLR expression and a differential levels of IL-1β among HbSS patients with and without pneumonia history (p=0.0253) and with hemoglobin concentration (p=0.0288) (Fig. 1). There was difference of TLR4 mRNA expression between HbSS patients groups without and with leg ulcers history (0.320+0.302 and 1.60+0.014) respectively (p=0.0016); with platelets count between HbSS patients groups with TLR2 expression < 50th (569.7+3.512) and > 50th (304.5+111.7) (p=0.0102) and reticulocytes count between HbSS patients groups with TLR2 expression < 50th (15.97+2.450) and > 50th (2.025+2.417) (p=0.0007) and of TNF-alpha concentration in DCs supernatant culture among HbSS patients with TLR5 expression < 50th (30.57+11.92) and > 50th (7.053+6.918) (p=0.0496) and of IL-10 concentration in DCs supernatant culture among HbSS patients with TLR5 expression < 50th (3.525+0.921) and > 50th (5.790+1.226) (p=0.0374) (Fig.2). It was also found statistic difference of IL-1 beta concentration in DCs supernatant culture post LPS stimulus between HbSS patients without and with pneumonia history (P=0.0253); analysis of TLR4 mRNA expression between HbSS patients without and with leg ulcer history (P=0.0016); analysis of hemoglobin concentration between HbSS patients with different plasma IL-1 beta concentration (P=0.0288)
Ours results show that these molecules and cell type possibly have an important role in maintain the inflammatory state described in this disease.
Analyses of IL-1 beta concentration in DCs supernatant culture post LPS stimulus between HbSS patients without and with pneumonia history (A-C); analysis of TLR4 mRNA expression between HbSS patients without and with leg ulcer history (D); analysis of hemoglobin concentration between HbSS patients with different plasma IL-1 beta concentration (E) and analyses of IL-1 beta, TNF-alpha and IL-10 concentration pre and post LPS stimulus (F-H). Statistical analyses in A-C and E-F were developed using the Wilcoxon signed rank test (two-tailed); in D was used the unpaired T test (two-tailed).
Analyses of IL-1 beta concentration in DCs supernatant culture post LPS stimulus between HbSS patients without and with pneumonia history (A-C); analysis of TLR4 mRNA expression between HbSS patients without and with leg ulcer history (D); analysis of hemoglobin concentration between HbSS patients with different plasma IL-1 beta concentration (E) and analyses of IL-1 beta, TNF-alpha and IL-10 concentration pre and post LPS stimulus (F-H). Statistical analyses in A-C and E-F were developed using the Wilcoxon signed rank test (two-tailed); in D was used the unpaired T test (two-tailed).
Analyses of platelets and reticulocytes counts associated to TLR2 expression and of TNF-alpha and IL-10 concentration associated to TLR5 expression. A) Platelets count between HbSS patients groups with TLR2 expression; B) Reticulocytes count between HbSS patients groups with TLR2; C) TNF-alpha concentration in DCs supernatant culture among HbSS patients with TLR5 expression; D) IL-10 concentration in DCs supernatant culture among HbSS patients with TLR5expression. Statistical analyses were developed using the unpaired T test (two-tailed).
Analyses of platelets and reticulocytes counts associated to TLR2 expression and of TNF-alpha and IL-10 concentration associated to TLR5 expression. A) Platelets count between HbSS patients groups with TLR2 expression; B) Reticulocytes count between HbSS patients groups with TLR2; C) TNF-alpha concentration in DCs supernatant culture among HbSS patients with TLR5 expression; D) IL-10 concentration in DCs supernatant culture among HbSS patients with TLR5expression. Statistical analyses were developed using the unpaired T test (two-tailed).
No relevant conflicts of interest to declare.


This feature is available to Subscribers Only
Sign In or Create an Account Close Modal