Abstract

Abnormalities of pulmonary circulation as a complication of sickle cell disease (SCD) have gained considerable attention recently. Recent studies have indicated that a tricuspid regurgitation velocity (TRV) of greater than 2.5 m/s is associated with a higher risk for early mortality, but has a poor predictive value for pulmonary hypertension (PH). In patients who do develop PH, focus has been on identifying abnormal increases in pulmonary vascular resistance (PVR) and its afterload effect on the right ventricle (RV). However, this is a relatively late finding in any pulmonary vasculopathy, and is an even more uncommon finding in SCD. Pulmonary compliance (Cp) is another physiologic parameter that indexes the pulsatile load of the RV, and is also an important contributor to RV afterload. It is thought that although Cp-PVR coupling remains constant due to the intrinsic properties of pulmonary vasculature, a decrease in Cp may be observed prior to any increase in PVR during the early development of PH. The objective of this study was to examine the range of Cp in a SCD cohort with an elevated TRV and the relationship of Cp to other hemodynamic and clinical characteristics.
A retrospective observational cohort study was conducted consisting of 22 adult consecutive SCD patients (HbSS, HbS/β0thalassemia, HbSC) with a RV systolic pressure of greater than 40 mmHg, TRV of ≥ 2.8 m/s or symptoms/signs of heart failure who underwent right heart catheterization between January 2009 and July 2012. Eight age- and gender-matched normal controls (healthy patients with no PH) and eleven PAH controls (patients with known non-SCD pulmonary arterial hypertension) were also included. Cp was calculated as stroke volume (SV) divided by pulmonary artery pulse pressure (PP). PVR was calculated as mean pulmonary artery pressure (mPAP) minus mean pulmonary capillary wedge pressure (PCWP mean) divided by cardiac output x 80. PH was defined as having a mPAP ≥ 25 mmHg. Patients were further classified as pulmonary arterial hypertension (pre-capillary PH) if PCWP mean was ≤ 15 mmHg and pulmonary venous hypertension (post-capillary PH) if PCWP mean was > 15 mmHg. The SCD population without PH was divided a prioriinto two groups based on the median Cp: Low Cp (Cp < 7) and High (Cp ≥ 7) with 10 subjects in each group.
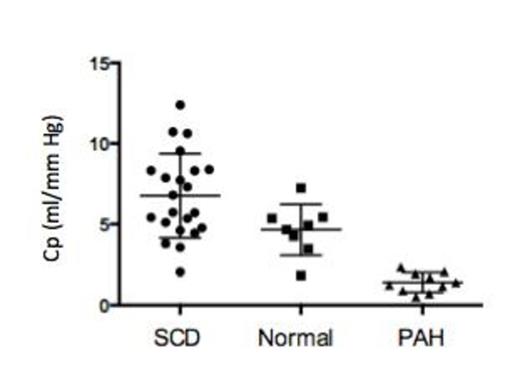
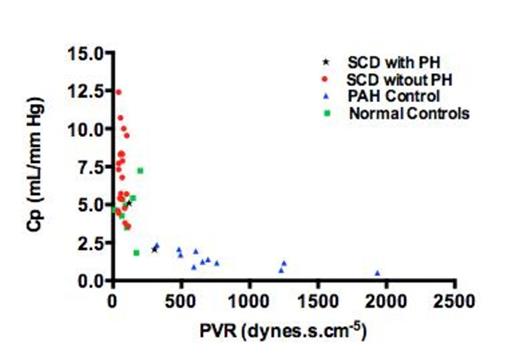
In our cohort, as anticipated, there was a low prevalence of patients who met the formal criteria of PH (2/22, 9%). SCD patients, regardless of the PH diagnosis, were found to have an overall higher and wider distribution of Cp value when compared to normal and PAH control groups (6.8 ± 2.6 vs. 4.7 ± 1.6 vs. 1.4 ± 0.6 mL/mmHg in the SCD, normal cohort and PAH control group respectively P < 0.001, Figure 1). Subgroup analysis of High and Low Cp groups without PH revealed no differences in baseline characteristics (age, body mass index, genotype, hydroxyurea use), laboratory values (hemoglobin, fetal hemoglobin fraction, reticulocyte count, total bilirubin and creatinine) or sickle cell-related complications (frequency of acute chest syndrome, leg ulcers, priapism, painful vaso-occlusive crises). The following hemodynamic variables were found to be different between the High Cp and Low Cp group respectively: mean RA pressure (1.8 ± 2.1 vs. 4.9 ± 3.1 mmHg, P = 0.0175), mPAP (12.3 ± 2.1 vs. 17.5 ± 5.3 mmHg, P = 0.0095), PCWP mean (6.3 ± 2.5 vs. 10.4 ± 4.9 mmHg, P = 0.0321) and PP (13.0 ± 2.6 vs. 21.3 ± 7.6 mmHg, P = 0.0044). The Cp-PVR coupling demonstrated in the wider PH literature was preserved in our cohort with non-PH SCD patients distributed largely along left upper corner of the curve with higher Cp values and the PH SCD patients in the left lower corner (Figure 2).
Pulmonary Compliance (Cp) of SCD patients in comparison to age and gender matched normal and PAH controls
Pulmonary Compliance (Cp) of SCD patients in comparison to age and gender matched normal and PAH controls
Pulmonary Compliance (Cp) and Pulmonary Vascular Resistance (PVR) coupling in SCD, normal and PAH control patients
Pulmonary Compliance (Cp) and Pulmonary Vascular Resistance (PVR) coupling in SCD, normal and PAH control patients
No relevant conflicts of interest to declare.
Author notes
Asterisk with author names denotes non-ASH members.

This icon denotes a clinically relevant abstract


This feature is available to Subscribers Only
Sign In or Create an Account Close Modal