Abstract
Does the dogma that multiple myeloma is incurable still hold?. The genomic chaos and resulting resistance to apoptosis of myeloma, long considered an obstacle to cure, formed the basis of Total Therapy (TT) program. The TT approach uses all myeloma-active drugs upfront to target drug-resistant subclones during initial treatment to prevent later relapse. Long-term follow-up of 1202 patients (TT1: n = 231, median follow-up: 21 years; TT2: 668, median follow-up: 12 years; TT3a: n = 303, median follow-up: 9 years) permitted investigation of whether progression-free survival (PFS) and complete response (CR) duration were consistent with curability, ie observation of plateaus in Kaplan-Meier plots for PFS and CR duration. In the subset of 627 patients with plasma cell gene expression profiling data, cure plateaus were apparent at 5 years in the 14% with high-risk myeloma compared with 10 years in the remainder with low-risk disease. A parametric model based on PFS and CR duration supported an increase in curability: 10-year PFS and CR estimates increased from 8.8%/17.9% in TT1 to 15.5%/28.2% in TT2’s control arm to 25.1%/35.6% in TT2’s thalidomide arm and to 32.9%/48.8% in TT3a. Toward developing novel therapies, we recommend a concerted focus on patients with high-risk myeloma whose outcome has not been advanced.
Introduction
Multiple myeloma (MM) is widely considered incurable, although some investigators have recently challenged this dogma.1-8 A minimum of 10 years seemed to be required to determine whether a plateau in progression-free survival (PFS) has emerged. The median follow-up times of initial trial reports are in the 3- to 5-year range. Subsequent reporting of mature data are sparse, preventing determination of curability. Here, we address the curability of myeloma from the vantage point of having followed all patients treated in the Arkansas program for life.
The presence of profound intratumoral heterogeneity (ITH) is thought to be the root cause for the perceived lack of curability in MM.9,10 ITH increases progressively from the stages of monoclonal gammopathy of undetermined significance (MGUS)11 and asymptomatic MM (AMM)12 to symptomatic or clinical MM (CMM) requiring therapy.13 Such genomic chaos formed the rationale for applying all MM-active therapies upfront in our Total Therapy (TT) trials aimed at eradicating preemptively drug-resistant MM subclones. Incorporating new agents with novel mechanisms of action into transplant trials has markedly contributed to improved outcomes14 by achieving high rates of complete remission (CR) as an essential first step toward long-term disease control and cure.15-17 Recent trials with novel agent combinations have achieved high CR rates comparable to those previously reported only with transplants.18 The quality of comparable rates of CR effectuated by different treatment approaches can be judged by their durability after cessation of treatment. It is hoped that more refined measurements of the depth of response can provide valuable early surrogates for the anticipated duration of MM control. The detection of minimal residual disease (MRD) by flow cytometry19,20 and the use of other biomarkers of cure are important for the early assessment of long-term outcome and consequently more rapid progress toward curative therapies.
Intratumor heterogeneity is a hindrance to cure
One of the major impediments to curing MM is ITH. This term refers to the coexistence of tumor subclones displaying differences in drug sensitivity, explaining the Darwinian basis for myeloma progression and the development of drug resistance.21 We described the presence of ITH using next-generation sequencing and single-cell analyses.22,23 Based on results of whole-genome sequencing of samples from MGUS, high-risk AMM, and CMM, it has been demonstrated that most genetic changes in CMM are already present at the AMM stage and concluded that clonal progression is the key feature of transformation from benign clinical disease to CMM.24 The clinical importance of ITH is also illustrated by the use of genome mapping technology.25 In response to various 2- or 3-drug combinations, a “clonal tiding” pattern was observed,26 where different and progressively fewer dominant clones emerged during serial relapses.
Direct clinical evidence for ITH comes from modern imaging studies. We showed persistence of magnetic resonance imaging (MRI)-defined focal lesions in serological and hematological CR,27 extending to the level of MRD negativity defined by multicolor flow cytometry.28 With further follow-up, about 60% of patients qualified for MRI-defined CR (MRI-CR) emerging almost 2 years after onset of clinical CR. Positron emission tomography scan findings of baseline differences in metabolic activity of intramedullary focal lesions regressing after therapy with different kinetics underscore to the clinical observer the reality of ITH.29-31
Update on Total Therapy trials provides evidence of curability in MM
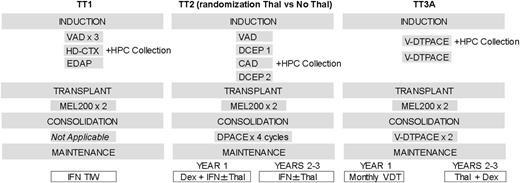
Based on the presence of clonal heterogeneity,32,33 we applied the St. Jude Total Therapy concept of using all active treatment ingredients, which has been highly successful in pediatric acute lymphocytic leukemia,34 to presenting newly diagnosed cases with CMM. The primary components of our successive trials are given in Figure 1. TT1 results proved to be superior to outcomes reported from a contemporary US cooperative group trial.35 Thalidomide’s remarkable activity in relapsed refractory MM36 formed the basis for initiating TT2 as a randomized phase 3 trial with thalidomide in the experimental arm.37 Compared with TT1, TT2 induction therapy also included a series of non-cross-resistant combinations prior to and introducing consolidation chemotherapy following melphalan-based tandem transplants, which was followed by dexamethasone plus interferon as indefinite maintenance. The activity of bortezomib in advanced and refractory MM38 provided the basis for adding this proteasome inhibitor upfront in TT3a.39-42 The basic schema of induction, tandem transplant, and consolidation remained as in TT2. All patients received thalidomide based on the superior results obtained in the thalidomide arm.43 Maintenance consisted of 1 year of bortezomib and 2 years of dexamethasone plus thalidomide.
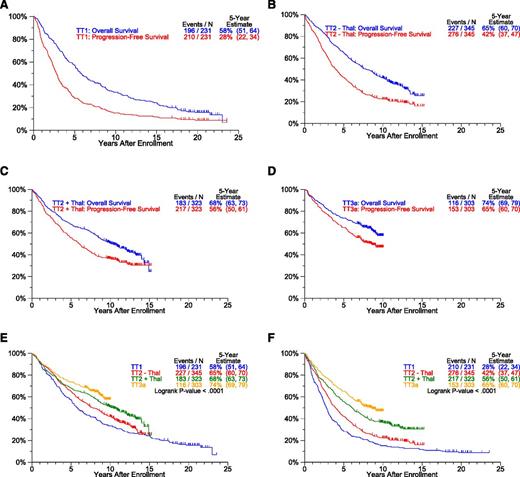
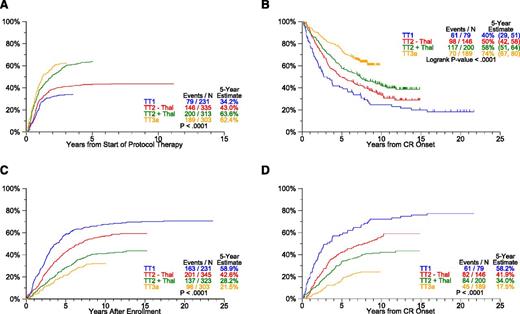
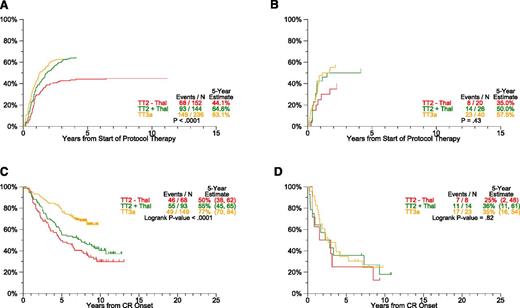
The baseline characteristics of patients accrued to TT trials are similar across studies (supplemental Table 1, see supplemental Data available at the Blood Web site). Clinical outcomes, updated March 26, 2014, are presented in Figures 2-3. The median follow-up is 21 years for TT1 (n = 35/231), 12 years for TT2 (n = 258/668), and 9 years for TT3a (n = 187/303). OS and PFS plots progressively move closer together with each successive TT trial so that the ratios of estimated 5-year OS-to-PFS decrease (TT1, 2.1; TT2-Thal, 1.6; TT2+Thal, 1.2; TT3a, 1.1) (P < .001) (Figure 2A-D). Thus, although increased use of all available therapeutic tools upfront shortened postrelapse survival, the gap between OS and PFS narrowed toward increasing cure fractions. With the transition from TT1 to later trials, significant improvements occurred in patient OS and PFS (Figure 2E-F). We next examined response and progression estimates which all were favored with transition to later protocols (Figure 3). Importantly, despite similar cumulative incidence of CR plots, CRD in TT3a, incorporating upfront bortezomib, was significantly prolonged in comparison with TT2+Thal (Figure 3A-B). This observation suggests that TT3a promoted a deeper level of CR, which we hope to quantitate by MRD flow cytometry in current trials. The 5-year estimates of TTP and TTR from CR progressively declined in successive trials: 59% and 58% in TT1, 43% and 41% in TT2–Thal, 28% and 33% in TT2+Thal, and 22% and 18% in TT3a, respectively (Figure 3C-D).
Survival estimates by protocol. Overall survival (OS) and PFS curves (A-D) show progressive narrowing with transition from TT1 to TT2-Thal to TT2+Thal to TT3a. Progressive improvement between protocols in OS and PFS is apparent (E-F). (A) OS and PFS: TT1. (B) OS and PFS: TT2 - Thal. (C) OS and PFS: TT2 + Thal. (D) OS and PFS: TT3a. (E) OS by protocol. (F) PFS by protocol.
Survival estimates by protocol. Overall survival (OS) and PFS curves (A-D) show progressive narrowing with transition from TT1 to TT2-Thal to TT2+Thal to TT3a. Progressive improvement between protocols in OS and PFS is apparent (E-F). (A) OS and PFS: TT1. (B) OS and PFS: TT2 - Thal. (C) OS and PFS: TT2 + Thal. (D) OS and PFS: TT3a. (E) OS by protocol. (F) PFS by protocol.
Response and progression estimates by protocol. The cumulative incidence of CR (A) translates into longer CR duration (CRD) (B). Of note, despite similar times of onset of CR in TT2+Thal and TT3a, CRD is far superior with TT3a, suggesting that a deeper level of CR was effectuated. With transition to later protocols, the slopes of time to progression (TTP) (C) and time to relapse (TTR) from CR (D) progressively flatten and reach lower plateaus. (A) Cumulative incidence of CR. (B) CRD by protocol. (C) TTP. (D) TTR from CR.
Response and progression estimates by protocol. The cumulative incidence of CR (A) translates into longer CR duration (CRD) (B). Of note, despite similar times of onset of CR in TT2+Thal and TT3a, CRD is far superior with TT3a, suggesting that a deeper level of CR was effectuated. With transition to later protocols, the slopes of time to progression (TTP) (C) and time to relapse (TTR) from CR (D) progressively flatten and reach lower plateaus. (A) Cumulative incidence of CR. (B) CRD by protocol. (C) TTP. (D) TTR from CR.
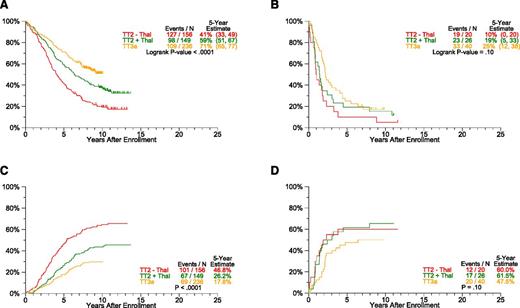
A subset of 627 patients enrolled in TT2 and TT3a trials had available gene expression profiling (GEP) data. Outcomes differed markedly between GEP70-defined low-risk and high-risk disease (Figure 4): 5- years PFS rates for low-risk CMM were 41% in TT2–Thal, 59% in TT2+Thal, and 71% in TT3a (P < .0001) (Figure 4A), whereas those for high-risk CMM were 10%, 19%, and 25%, respectively (P = .10) (Figure 4B). Estimates of TTP showed significant declines with later protocols only in low-risk and not in the high-risk subgroup (Figure 4C-D). Although the cumulative incidence of CR within a given protocol did not differ between the 2 risk groups (Figure 5A-B), gains were apparent for CRD in low-risk but not in high-risk disease (Figure 5C-D). Interestingly, PFS, CRD, and TTP curves reached plateaus at ∼5 years in high-risk CMM, as opposed to >10 years in low-risk CMM.
Progression estimates by protocol and GEP-70 risk. PFS and TTP are analyzed according to plasma cell GEP-based low- and high-risk subsets. Common to all endpoints examined, plateaus are reached earlier at ∼5 years in high-risk (B: PFS, D: TTP) compared with 10 years in the majority of 85% of patients with low-risk myeloma (A: PFS, C: TTP). (A) PFS by protocol: GEP-70 low-risk only. (B) PFS by protocol: GEP-70 high-risk only. (C) TTP: GEP-70 low-risk only. (D) TTP: GEP-70 high-risk only.
Progression estimates by protocol and GEP-70 risk. PFS and TTP are analyzed according to plasma cell GEP-based low- and high-risk subsets. Common to all endpoints examined, plateaus are reached earlier at ∼5 years in high-risk (B: PFS, D: TTP) compared with 10 years in the majority of 85% of patients with low-risk myeloma (A: PFS, C: TTP). (A) PFS by protocol: GEP-70 low-risk only. (B) PFS by protocol: GEP-70 high-risk only. (C) TTP: GEP-70 low-risk only. (D) TTP: GEP-70 high-risk only.
Response estimates by protocol and GEP-70 risk. Cumulative incidence of CR (CRI) and CRD are analyzed according to plasma cell GEP-based low- and high-risk subsets. Common to all endpoints examined, plateaus are reached earlier in high-risk (B: CRI, D: CRD) than patients with low-risk myeloma (A: CRI, C: CRD). (A) Cumulative incidence of CR: GEP-70 low-risk only. (B) Cumulative incidence of CR: GEP-70 high-risk only. (C) CRD by protocol: GEP-70 low-risk only. (D) CRD by protocol: GEP-70 high-risk only.
Response estimates by protocol and GEP-70 risk. Cumulative incidence of CR (CRI) and CRD are analyzed according to plasma cell GEP-based low- and high-risk subsets. Common to all endpoints examined, plateaus are reached earlier in high-risk (B: CRI, D: CRD) than patients with low-risk myeloma (A: CRI, C: CRD). (A) Cumulative incidence of CR: GEP-70 low-risk only. (B) Cumulative incidence of CR: GEP-70 high-risk only. (C) CRD by protocol: GEP-70 low-risk only. (D) CRD by protocol: GEP-70 high-risk only.
Several statistical models were used to analyze TT outcomes. Relative survival was calculated as the ratio of observed to expected survival, based on US population life tables matched for age and gender44 ; the ratios were estimated at 1-year intervals, given survival to the beginning of that interval (supplemental Figure 1). A relative survival ratio of at least 1 means patient mortality does not exceed that of the general population. Although there is some variability in the estimates, especially for the later times, relative survival ratios approach 1 at 10 to 15 years for TT1, but this occurs earlier, at 5 to 10 years, for TT2+Thal and TT3a. A parametric mixture cure model45 was used to estimate PFS and CRD for each protocol, overall and by GEP-70 risk from baseline, as well as from a 5-year landmark for all patients. The general idea behind the model is that there are 2 groups: those that are at risk for the event of interest and those that are not. The combined survival probability is represented as a mixture of the survival probabilities for these 2 groups. Mathematically, the model states that the PFS or CRD curve, S(t), is given by S(t) = p + (1 – p) S1(t), where p is the cured fraction (long-term progression-free or relapse-free survivors), and S1(t) is the curve for the remaining fraction. In our models, S1(t) was assumed to follow a Weibull distribution. The cure model fit the data well and provided cure-fraction estimates that increase with later protocols and when examined from baseline and a 5-year landmark (supplemental Figure 2). Plateaus for both PFS- and CRD-based cure fractions emerged at 10 years in low-risk CMM and at 5 years in high-risk CMM (supplemental Figure 3). Numeric data are presented for all patients in Table 1 (regardless of GEP risk). PFS-based cure-fraction estimates increased significantly with successive TT trials: 9% in TT1, 16% in TT2–Thal, 25% in TT2+Thal, and 33% in TT3a (P = .04); CRD-based cure-fraction estimates were 18%, 28%, 36%, and 49%, respectively (P = .17). When a 5-year landmark was applied to exclude early myeloma-related events, PFS-based cure fraction estimates were 28% in TT1, 39% in TT2–Thal, 51% in TT2+Thal, and 70% in TT3a (P < .001); in this setting, CRD-based cure fraction estimates were 32%, 47%, 56%, and 75%, respectively (P = .007).
Cure fraction estimates by protocol, using PFS and CRD
| Protocol . | PFS . | CRD . | ||
|---|---|---|---|---|
| N . | Cure fraction, % . | N . | Cure fraction, % . | |
| From start of therapy | ||||
| TT1 | 231 | 8.8 | 79 | 17.9 |
| TT2 - Thal | 345 | 15.5 | 146 | 28.2 |
| TT2 + Thal | 323 | 25.1 | 200 | 35.6 |
| TT3a | 303 | 32.9 | 189 | 48.8 |
| From 5-y landmark | ||||
| TT1 | 65 | 28.4 | 33 | 32.3 |
| TT2 - Thal | 145 | 39.2 | 84 | 47.4 |
| TT2 + Thal | 150 | 51.1 | 134 | 55.9 |
| TT3a | 197 | 69.8 | 148 | 74.7 |
Is MRD negativity an essential element for cure?
We have applied a sensitive 8-color flow cytometric approach for the assessment of MRD.19,28 In contrast to published reports focusing measurements on a landmark of 100 days after transplant, we examined MRD status in >10 years’ progression-free survivors of TT1 and TT2 protocols. In TT1, 35 surviving patients of the original 231 have been followed for at least 17 years; 21 remain progression-free, and 1 each was MRD-negative and MRD-positive among the 2 patients tested. In the case of TT2, all 258 currently surviving patients of initially 668 have been followed for at least 10 years. Of 175 patients remaining progression-free, MRD testing was performed in 83 patients along with reexamination of clinical CR status. Table 2 depicts, for combined TT1 and TT2 data, the relationship between clinical CR and MRD status. Among 85 patients, 68 qualified for CR of whom 64 proved to be MRD-negative; among 17 patients not in CR, 14 were deemed MRD-positive and 3 MRD-negative. Collectively, these data indicate that the majority of long-term CR patients also qualified for MRD negativity. A minority of patients had discordant readings between CR and MRD designations, 4 CRs were MRD-positive and 3 MRD-negative patients did not fulfill clinical CR criteria. In light of persistence of MRI-defined focal lesions in clinical CR and MRD negativity, further refinements of “global” patient CR and MRD designations are anticipated.
Correlation between clinical CR and MRD status
| . | TT1 + TT2 combined . | ||
|---|---|---|---|
| <CR . | CR . | Total . | |
| MRD+ | 14 | 4 | 18 |
| MRD− | 3 | 64 | 67 |
| Total | 17 | 68 | 85 |
| . | TT1 + TT2 combined . | ||
|---|---|---|---|
| <CR . | CR . | Total . | |
| MRD+ | 14 | 4 | 18 |
| MRD− | 3 | 64 | 67 |
| Total | 17 | 68 | 85 |
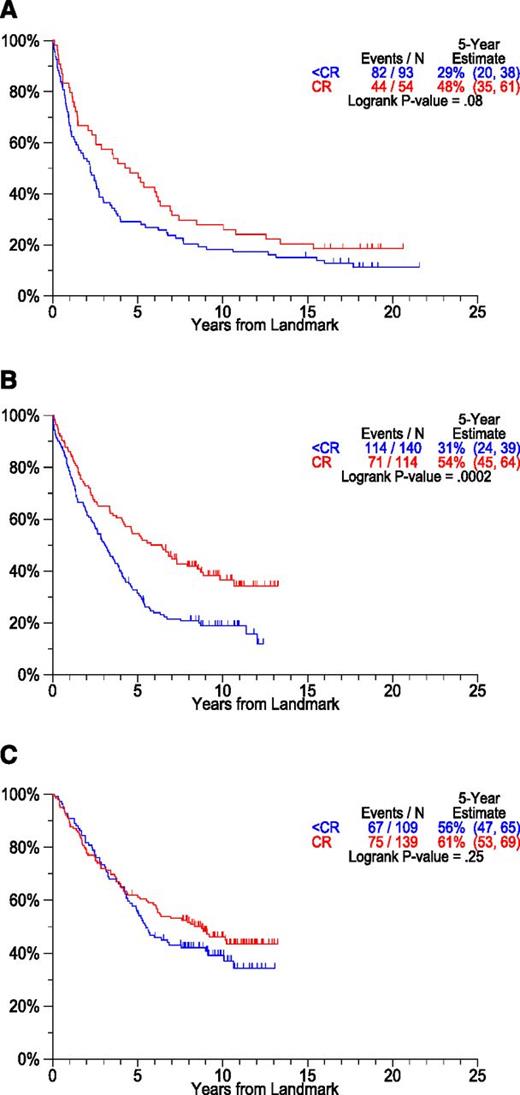
Although most investigators consider CR a prerequisite for long-term PFS and cure,46-52 we reported previously that PFS and OS were not compromised by lack of CR in patients with documented preceding AMM53 and those with MGUS-like CMM based on GEP.54,55 However, CR was crucial for long-term PFS and OS in high-risk CMM.56 We also addressed the importance of a critical duration of CR for PFS durability.57 Best outcomes were observed when CR was sustained beyond a 3-year landmark. Those failing to achieve CR but remaining progression-free during this time frame fared better than patients attaining and losing CR. With long-term follow-up available in TT1 and TT2 trials, we examined the role of CR for long-term prognosis from a 2-year landmark (Figure 6). Although PFS was superior in patients remaining in CR at 2 years, plateaus were also apparent among non-CR patients. Thus, although a critical early event in terms of the degree of tumor mass reduction, CR is not essential for long-term disease control in all cases.
PFS by CR status at 2-year landmark by protocol. Patients considered here were alive and progression-free at the 2-year landmark. Plateaus are seen in patients achieving CR and also in those with lesser responses prior to the 2-year landmark (A: TT1, B: TT2-Thal, C: TT2+Thal). (A) PFS by response at landmark. Landmarked 2 years from registration: TT1. (B) PFS by response at landmark. Landmarked 2 years from registration: TT2 - Thal. (C) PFS by response at landmark. Landmarked 2 years from registration: TT2 + Thal.
PFS by CR status at 2-year landmark by protocol. Patients considered here were alive and progression-free at the 2-year landmark. Plateaus are seen in patients achieving CR and also in those with lesser responses prior to the 2-year landmark (A: TT1, B: TT2-Thal, C: TT2+Thal). (A) PFS by response at landmark. Landmarked 2 years from registration: TT1. (B) PFS by response at landmark. Landmarked 2 years from registration: TT2 - Thal. (C) PFS by response at landmark. Landmarked 2 years from registration: TT2 + Thal.
In search of an early surrogate marker for cure in CMM
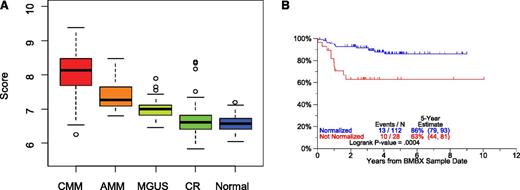
It is widely recognized that MM cells engage the bone marrow microenvironment for their survival and expansion and, through these interactions with stroma, receive signals that are responsible for cell adhesion-mediated drug resistance.58 Additional data suggest that the progression from MGUS to AMM to CMM is mediated via a change in stromal cell behavior, possibly mediated via an angiogenic switch, the underlying mechanism of which is under investigation.59,60 We, therefore, compared GEP signatures of whole bone marrow biopsies from healthy donors and from patients with MGUS, AMM, and CMM in CR or at baseline prior to therapy (Figure 7). A median 37-gene score was highest in CMM at baseline and decreased progressively in comparisons of AMM to MGUS to CR and normal donors (Figure 7A); the 37-gene score had a wider spread in CR patients than in healthy volunteers. GEP data of bone marrow biopsies from patients who achieved and remained in CR were compared with those of age- and gender-matched healthy donors. Preliminary data indicate that normal-like GEP signatures can be achieved during CR and are associated with outcomes superior to those associated with MM-like signatures (Figure 7B).
GEP of bone marrow biopsy material. GEP of whole bone marrow biopsy material encompasses in both hematopoietic and bone marrow microenvironmental tissues. In the case of myeloma and precursor conditions, myeloma plasma cells coexist in the biopsy material with normal hematopoietic and stromal elements. Marked differences in the 37-gene score were noted between CMM, AMM, MGUS, CR, and normal donors (A). Myeloma patients qualifying for CR status and whose bone marrow biopsy becomes normal donor-like (“normalization”) enjoy superior CR duration than their counterparts not qualifying for normalization. CRD according to “normalization” of bone marrow biopsies of patients with MM was compared (CRD by normalization status for patients in CR using first GEP sample after 2 years of CR) (B).
GEP of bone marrow biopsy material. GEP of whole bone marrow biopsy material encompasses in both hematopoietic and bone marrow microenvironmental tissues. In the case of myeloma and precursor conditions, myeloma plasma cells coexist in the biopsy material with normal hematopoietic and stromal elements. Marked differences in the 37-gene score were noted between CMM, AMM, MGUS, CR, and normal donors (A). Myeloma patients qualifying for CR status and whose bone marrow biopsy becomes normal donor-like (“normalization”) enjoy superior CR duration than their counterparts not qualifying for normalization. CRD according to “normalization” of bone marrow biopsies of patients with MM was compared (CRD by normalization status for patients in CR using first GEP sample after 2 years of CR) (B).
Challenges and opportunities for developing novel curative trials in CMM
Most of our cured patients have CMM that is classified by the GEP70 model as low risk and have been followed for at least 10 years. A review of mature trials that used novel agents without or with transplantation shows that their follow-up times are not yet sufficient for cure plateaus to have emerged.61,62 High CR rates approaching or even exceeding those reported after transplants have been reported after novel agent combinations without transplants, especially for combination regimens of carfilzomib, lenalidomide, and dexamethasone18 and of carfilzomib, cyclophosphamide, and dexamethasone.63 However, it is not yet clear whether CR achieved by these therapies is as durable as that induced with transplant-supported high-dose melphalan. We suggest that melphalan-type therapy may target MM stem cells with aggressive clinical behavior and thus prevent or at least reduce late relapse, thus inducing long-lasting benefits with cure potential but that nongenotoxic drugs may require chronic therapy. Several more years of follow-up will be required to answer this important question.
Our data show that for patients with high-risk CMM, novel therapies are needed. Even with TT approaches, median PFS of these patients is only 2 years although a small cure fraction of ∼15% does emerge at 5 years. Work is in progress to determine whether earlier disease progression in high-risk CMM may be linked to a lower depth of CR as judged by sensitive MRD detection strategies.
In reflecting on the failure of our TT approach to advance clinical outcomes in high-risk MM, we considered the role of “cytokine storms” ensuing after chemotherapy or autologous transplants for steady-state normal hematopoiesis to be established. By exerting stimulatory effects also on MM cells, such cytokine release may contribute to MM survival and disease escape. Our recently published metronomic therapy using low doses of cytotoxic agents (doxorubicin, cisplatin) in combination with bortezomib, thalidomide, and dexamethasone was exquisitely devoid of bone marrow toxicity.64 Extending treatment to 28 days, we offered such therapy to 10 transplant-ineligible newly diagnosed patients with high-risk CMM. Treatment was well tolerated and brought about CR in 5 patients at the conclusion of 1 cycle, lasting unmaintained for up to 8 months (B.B., unpublished observations). In light of poor outcomes in high-risk CMM, we are following 1-cycle CR patients closely to determine the length of benefit and especially whether “downgrading” from GEP-defined high to low risk can be demonstrated.
Exome sequencing revealed a prevalence of K-RAS, N-RAS, and BRAFF mutations especially in advanced CMM.9,10,32,33 Using the MEK inhibitor trametinib,65 we have shown impressive preliminary response and have followed several patients with extra-medullary MM for 8+ months without recurrence. Applying such targeted therapies upfront in high-risk CMM will reveal whether durable CR’s can be attained or whether, due to ITH, relapses are inevitable. We are investigating whether, due to cross-talk among MM subclones, the efficacy of targeted therapies may also favorably affect off-target subclones.
Conclusions
The data presented here allow us to conclude that CMM has finally joined the “club” of curable malignancies. The assessment of curability, at least in the context of melphalan-based autotransplants, requires a minimum follow-up of 10 or more years. Based on CRD at baseline and a 5-year landmark, TT3a effectuated cure fractions estimated at almost 50% and 75%, respectively, pertaining to the majority of patients with GEP-defined low-risk MM. Among the 15% of patients with high-risk CMM, only 15% were estimated cured with an earlier plateau apparent at 5 years.
High CR rates comparable to those achieved with more toxic autotransplant-supported high-dose melphalan have recently been reported with the sole use of novel-agent combinations. Whether these different therapeutic approaches result in equally durable CR, longer follow-up is required. In the interim, we are concerned about prematurely abandoning transplants in favor of therapy solely based on novel agents. In light of the stagnant clinical outcomes in high-risk CMM, we strongly endorse novel agent trials specifically for patients with GEP-based high-risk CMM where readily interpretable outcome results would be available within 2 to 3 years. For low-risk CMM, the availability of surrogate endpoints for cure would enormously aid in designing clinical trials aimed at developing less toxic therapy. Such approaches would include individualized therapy content and duration, taking into consideration GEP-based molecular subgroups potentially benefiting from different novel agents. Thus, the MS (FGFR3/MMSET) molecular subgroup is no longer considered high-risk when bortezomib is included in its management.42 Candidate surrogate methods include flow cytometric analysis of MRD and GEP analysis of whole bone-marrow biopsies, the latter encompassing MM cells and the microenvironment. Results of either method can be complicated by MRI-defined and positron emission tomography–defined focal lesions or macrofocal growth patterns in many CMM patients, which can persist years after onset of clinical CR. Therefore, it may be necessary for standard iliac crest sampling to be complemented by focal lesion examinations. Alternatively, using micro RNA66 or exosome analysis67 of peripheral blood may emerge as a more powerful and quantitative approach, based on the notion of metastatic trafficking of MM cells between bone marrow and extramedullary sites.68 Although ITH is widely appreciated as the major obstacle to cure, our data indicate curability in both low- and high-risk CMM when applying TT principles.
The online version of this article contains a data supplement.
Acknowledgments
The authors wish to appreciate the dedication of the Myeloma Institute’s staff for caring for so many patients and their families with utmost dedication. We are indebted to our referring physicians. The Institute’s research nurses and data managers have been critical to the execution of our clinical research efforts. As we celebrate cure in myeloma, we remain humble in our recognition of the many lives lost in heroic battles with end-stage myeloma. We are committing ourselves to improving clinical outcomes in high-risk myeloma and to reducing treatment-related complications.
The senior author wishes to acknowledge his mentor, Dr Emil J Freireich, for having inspired the curability concept also for myeloma more than 25 years ago.
This work was supported in part by a grant from the National Cancer Institute, National Institutes of Health (grant number CA 55813).
Authorship
Contribution: B.B. conceptualized and wrote paper, was principal investigator of protocols, and enrolled and treated patients; A.M. performed statistical analyses; F.v.R. enrolled and treated patients and discussed results; J.E. discussed work and helped design clinical trials; G.J.M. helped write the paper; and J.C. conceptualized statistical analyses.
Conflict-of-interest disclosure: B.B. has received research funding from Celgene and Millennium, is a consultant to Celgene and Millennium, and is a co-inventor on patents and patent applications related to use of GEP in cancer medicine that have been licensed to Myeloma Health, LLC. The remaining authors declare no competing financial interests.
Correspondence: Bart Barlogie, Myeloma Institute for Research and Therapy, University of Arkansas for Medical Sciences, 4301 W Markham St #816, Little Rock, AR 72205; e-mail: barlogiebart@uams.edu.

