Abstract
Introduction:
The Wilms’ tumor 1 (WT1) gene, located on chromosome 11p13, encodes a transcription factor. WT1 is overexpressed in 90% of patients with acute myeloid leukemia (AML) and thus can be used for minimal residual disease (MRD) monitoring by quantitative RT-PCR. The aim of the present study was to analyze the usefulness of WT1 as a marker for MRD quantification in AML after chemotherapy.
Patients and Methods: This retrospective and multicentric study included 148 patients with WT1-overexpressed AML. Quantitative assessment of WT1 transcript levels was performed by quantitative RT-PCR in 370 bone marrow (BM) samples at diagnosis (148), post-induction (125) and post-consolidation (97). WT1 gene expression was calculated by relative quantification using the normalized ratio of the target gene (WT1) related to a reference gene (GUS) and using cell line K562 as calibrator. Inter-laboratories methodological standardization was accomplished through a pilot study with 20 BM donor samples, 20 BM patient samples and commercial WT1 plasmids (ProfileQuant Kit, Ipsogen-Qiagen).
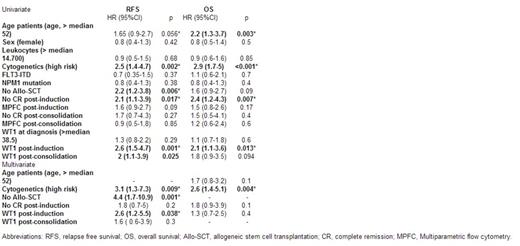
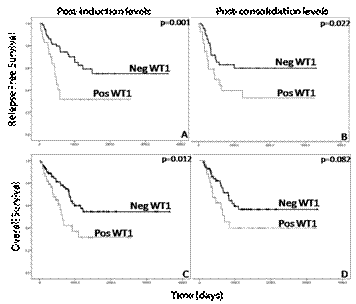
Results: No significant differences in WT1 gene expression (cycle threshold, Ct) were observed between different laboratories in the pilot study (kappa coefficient >0.7). The cut-off value of WT1 over-expression in BM was established for each laboratory (median+2SD values from healthy donors, data not shown). Median WT1 expression in patient samples at diagnosis was 38% (range, 2-850). Differential expression at diagnosis did not correlate with age, gender, leukocytes, karyotype (risk). However a significantly higher expression in patients with AML-M1 and AML-M2 subtypes as well as patients with mutant NPM1 and/or ITD-FLT3 was observed (p<0.05). On the other hand, WT1 BM levels at diagnosis were not correlated with relapse free survival (RFS) and overall survival (OS). All patients received intensive chemotherapy as induction treatment. After induction, 84.5% (125/148) of patients had available WT1 data, of which 23.45% (45/125) showed overexpression. After consolidation, 65.5% (97/148) of patients had available WT1 data, of which 28.9% (28/97) showedoverexpression. WT1 post-induction and consolidation levels were correlated with RFS and OS (Figure 1). These differences were greater when patients who were treated withallogeneic stem cell transplantation (allo-SCT) were excluded from the analysis: lower RFS [post-induction (2 years 70% vs. 8% p<0.001) and post-consolidation (2 years 58% vs. 0% p<0.001)] and lower OS [post-induction (2 years 75% vs. 34% p=0.031) and post-consolidation (2 years 74% vs. 26% p=0.004)] were obtained. Univariate and multivariate analysis were performed; high risk cytogenetic (complex karyotype), not allo-SCT and post-induction WT1 levels remained as independent prognostic factors in terms RFS (Table 1).
Conclusions: WT1 is a useful marker for MRD quantification in AML patients undergoing chemotherapy. Levels after induction and consolidation allow anticipation of relapse and survival. In the group of patients not treated with allo-SCT, results are especially relevant with greater statistically significant differences. Treatment intensification derived from positive post-chemotherapy WT1 levels with allo-SCT overcomes the poor prognosis.
Post-induction (A,C) and Post-consolidation (B,D).
Abbreviations: Neg. negative (normal levels o no overexpression; Pos: positive (overexpression).
No relevant conflicts of interest to declare.
Author notes
Asterisk with author names denotes non-ASH members.


This feature is available to Subscribers Only
Sign In or Create an Account Close Modal