Background: Accurate risk stratification is important for healthcare outcomes research in lymphoma, but prognostic scores like the IPI or revised IPI (R-IPI) have not been validated in population data. Such indices were generated from selective DLBCL cohorts excluding patients (pts) who did not receive curative chemotherapy. We compared performance of the IPI and R-IPI with a Cox model-based score (MBS) using data from the NCDB—a population registry capturing over 70% of incident cancer cases in the United States.
Methods: We studied DLBCL pts diagnosed in 2004-2006. The MBS was developed using a Cox model for overall survival (OS) in the training cohort of pts with unrecorded IPI. The model included age, sex, race, stage, extranodal primary site, B-symptoms, socioeconomic status and comorbidity index as prognostic factors. Cutoffs for risk groups were set at 16th, 50th and 84th percentiles of the linear predictor. Calibration and discrimination of the IPI, R-IPI and MBS were then compared in the validation cohort of pts with recorded IPI, measuring concordance probability estimate (CPE) and explained variation statistic (R2D) with 95% confidence intervals (CI). The ability to predict the R-IPI from raw registry data was evaluated using an ordinal generalized logistic model.
Results: IPI was recorded in 8,319 (19%) of 43,757 pts, of whom 77% received chemotherapy. The median age was 68 years (range, 18-90). There were 47% women, 88% of pts were white, 49% had stage III/IV, 27% had recorded B-symptoms and 34% extranodalDLBCL. Erroneous IPI values (judged from age/stage) were evident in 1,066 records (12.8%).
The concordance of MBS and IPI was low (Cohen’s k=0.19), yet the calibration and discriminating power for OS were significantly better for MBS compared with IPI or R-IPI (Table, Figure). The explained variation of survival was very low (15%) for IPI and R-IPI. The ability to predict R-IPI from registry data was fair (k=0.48, absolute agreement 72%). The predicted R-IPI had a CPE of 0.59 (CI, 0.59-0.60) and R2D of 10%.
All comparisons yielded similar results in a subcohort (N=30,698) of pts who received chemotherapy and did not have a recorded HIV infection or primary central nervous lymphoma (CPE, 0.65, 0.62 and 0.68 for IPI, R-IPI and MBS, respectively).
Conclusions: We validated the IPI and R-IPI as recorded by cancer registries to provide robust stratification in DLBCL, despite abstracting errors. R-IPI can be partly predicted from routinely collectedvariables, but a prognostic model based on raw registry data provides superior performance. Explicit recording of prognostic factors (lactate dehydrogenase, performance status) by cancer registries is thus preferable to abstracting coarsened clinical indices. The model-based score, or direct regression adjustment on prognostic factors, is preferable for comparative healthcare outcomes research using the NCDB or other population-based datasets. Considering low explained variation of survival using standard indices, availability of molecular markers absent in the IPI is essential for further improvement of risk stratification in DLBCL.
| . | Donor vs No donor . | . | Time dependent . | . | Landmark . | ||||||
|---|---|---|---|---|---|---|---|---|---|---|---|
| HR | 95%CI | p | HR | 95%CI | p | HR | 95%CI | p | |||
| OS | 1.22 | [0.81-1.86] | 0.345 | 0.89 | [0.57-1.39] | 0.601 | 0.82 | [0.51-1.33] | 0.422 | ||
| PFS | 0.80 | [0.56-1.13] | 0.201 | 0.69 | [0.47-0.99] | 0.047 | 0.63 | [0.43-0.93] | 0.019 | ||
| CIP | 0.60 | [0.41-0.88] | 0.008 | 0.49 | [0.33-0.75] | 0.001 | 0.46 | [0.30-0.71] | < 0.001 | ||
| NRM | 6.15 | [2.09-18.08] | 0.001 | 6.79 | [2.27-20.27] | 0.001 | 3.91 | [1.50-10.21] | 0.005 | ||
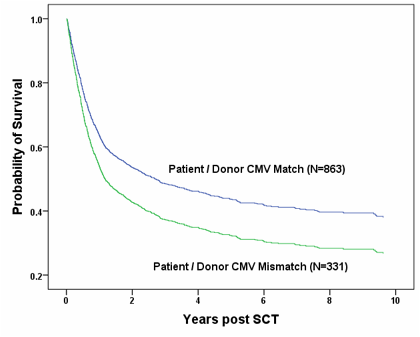
Adjusted survival curves showing the impact of CMV matching on overall survival
Adjusted survival curves showing the impact of CMV matching on overall survival
No relevant conflicts of interest to declare.
Author notes
Asterisk with author names denotes non-ASH members.


This feature is available to Subscribers Only
Sign In or Create an Account Close Modal