Abstract

Thalassemia is a group of genetically inherited hemoglobin (Hb) disorders characterized by reduced synthesis of the b-globin chain and a sub-sequent imbalance in the a/b-globin chain ratio that results in chronic hemolytic anemia. The severity of clinical phenotype is used to distinguish this heterogeneous disease in two main subtypes: Thalassemia Major (TM) and Thalassemia Intermedia (TI). Iron overload is mostly due to increased intestinal absorption because of chronic anemia. Transfusions, in contrast with what happens in TM, have a minor role in the development of iron overload. However, although 1-year data from the phase 2, prospective, randomized, double-blind, placebo-controlled trial and 1-year extension results from the THALASSA study assessing the efficacy and safety of deferasirox in TI patients with iron overload have been reported, no data, during randomized trials, have been so far published on Deferiprone (DFP) treatment (Taher et al Blood 2012 and Ann Hematol 2013)
Adult patients with TI were randomly assigned in permuted blocks of 10 with a ratio 1:1 to DFP at 75 mg/kg/day for 7 d/week divided into three oral daily doses (DFP-group) or DFO by sc infusion (8–10 h) at 50 mg/kg per day for 5 d/week (DFO-group). The study was designed to detect an improvement in decreasing mean serum ferritin levels in each of the treated-groups from the initiation of therapy to each year (from year 1 to year 5) with a significance level of 5% and 80% power. The planned number of subjects was between 40 and 100 (Rochon Biometrics 1991).
The primary endpoint was the treatment efficacy evaluated as change from the baseline value in serum ferritin levels during the 5 years assessed using a linear mixed-effects model (LMM, Laird-Ware Biometrics 1982) where we assumed the patient effect (given by the intercept terms for each patient) as random effect, while the treatment effect (treat), the time effect (time), the treatment-by-time interaction effect (treat×time), and the total transfusions in ml (tot TX) as fixed effects. Secondary endpoints were safety and survival analysis at 5-years evaluated considering the number of advers events and Kaplan-Meir curves respectively.
Overall 88 patients, observed at 12 SoSTE centers in Italy between January 2001 and May 2011, were randomized (47 DFP-group and 41 DFO-group). There were no differences observed at baseline between the two randomized groups in clinical and haematological findings.
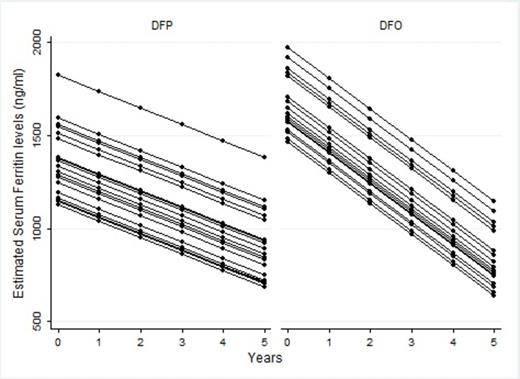
The regression coefficient of time suggested that there was a linear decrease over time in the mean serum ferritin levels in both treatment-groups even if the p-value was very close to the statistical significance (Coeff. -88.4, 95% CI (-182.4; 5.6), p-value =0.065). However, the mean serum ferritin levels did not seem to be significantly different between the two treatment-groups over time (Coeff. -77.4, 95% CI (-231.7; 77.1), p-value=0.326 ). The effect of total blood transfusion on serum ferritin levels was not statistically significant (Coeff. 0.06, 95% CI (-0.01; 0.1), p-value=0.100). The estimated profiles of serum ferritin levels in the two groups were represented in Figure I.
Agranulocytosis was reported in 4 case of DFP versus no cases of DFO group, respectively (p-value=0.118). Neutropenia was statistically significant different between the two groups DFP (6 (12.5%) versus no cases in DFO , p-value=0.027).
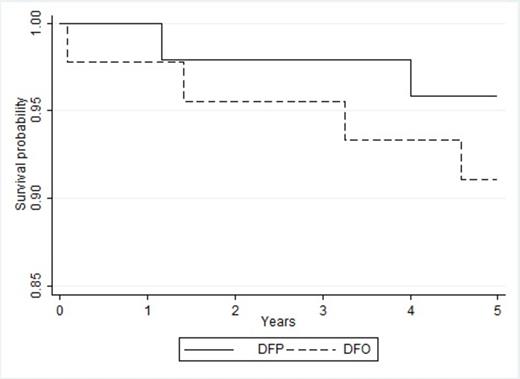
Kaplan-Meier survival probability curves for the two treatment groups are shown in Figure II, and the log-rank test did not show any statistically significant difference in the survival between the two groups (p-value=0.36).
In conclusion, these findings suggest as DFP shows same effectiveness and survival probability versus DFO with controlled safety profile. Therefore, these results support the possibility of using this drug in TI patients in which DFO and Deferasiorx is contraindicated.
Estimated profiles of the mean serum ferritin in the two treatment-groups from the fitted linear mixed-effects model.
Estimated profiles of the mean serum ferritin in the two treatment-groups from the fitted linear mixed-effects model.
Kaplan–Meier survival probability curves in the two treatment groups during multi-center TI clinical trial (DFP: continous line; DFO: dashed line), (p-value=0.36).
Kaplan–Meier survival probability curves in the two treatment groups during multi-center TI clinical trial (DFP: continous line; DFO: dashed line), (p-value=0.36).
No relevant conflicts of interest to declare.
Author notes
Asterisk with author names denotes non-ASH members.

This icon denotes a clinically relevant abstract


This feature is available to Subscribers Only
Sign In or Create an Account Close Modal