Abstract
Introduction: The diagnosis of heparin induced thrombocytopenia (HIT) and thrombosis (HITT) is challenging due to poor availability of the gold standard serotonin releasing assay (SRA) and suboptimal positive predictive value from clinical scoring models such as 4T score. A common algorithm used for diagnosing HIT is: 4T's pretest probability score estimation in cases suspected of HIT; followed by HIT antibody test in the intermediate to high risk groups; followed by confirmation with SRA test in HIT antibody positive patients. Since 2011, a Particle Immune-Filtration Assay (PIFA) Heparin/Platelet Factor 4 Rapid Assay (HPF4-RA) (Akers Bioscience, Inc, Thorofare, NJ) became available in our medical center and test results were available on the same day. We observed that HPF4-RA test was being routinely ordered along with SRA test at the same time. We performed this retrospective analysis to evaluate and compare the predictive performance for SRA positive HIT diagnosis using 4T score or HPF4-RA. We applied a regression analysis model, to calculate area under receiver operating characteristics (ROC) curve.
Methods: A list of all consecutive patients who had HIT antibody test and/or SRA test performed between January 2010 and June 2013 was obtained, which consisted of 402 patients. Patients with duplication of tests were deleted from analysis. 283 patients had results reported for both HPF4-RA (positive in n=42, negative in n=241) and SRA tests (positive in n=16 and negative in n=267); and these results were used for calculation of HPF4-RA prediction model. Two patients had HPF4-RA negative result but SRA positive test result. 4T's scores were calculated for 125 patients, consisting of all HPF4-RA positive patients (n=42), and patients randomly selected from the total HPF4-RA negative pool (n=83). Electronic medical records were reviewed for temporal trend of platelet counts, diagnosis, medication use, Doppler tests and competing causes of thrombocytopenia. Persons calculating the 4T's score were blinded to the laboratory test results.
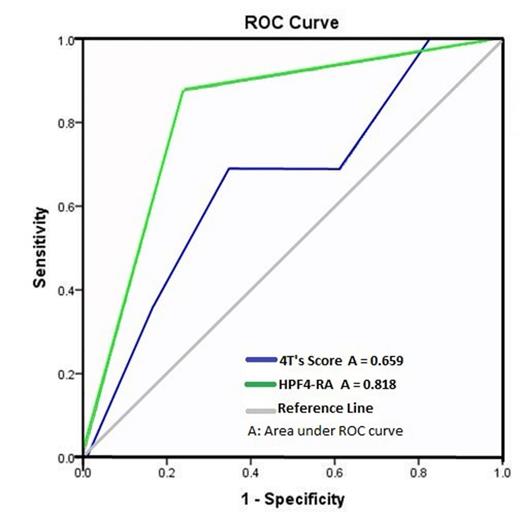
Results: Stratification of the patients with 4T's score analysis (n=125) revealed that the distribution of SRA positive patients (n=16) was 31.3% (n=5) in low risk, 31.3% (n=5) in intermediate risk, and 37.5% (n=6) in high risk groups; while the distribution of SRA negative patients (n=109) was 45.9% (n=50) in low risk, 43.1% (n=47) in intermediate risk and 11.0% (n=12) in high risk groups. The area under receiver operating characteristics (ROC) curve for 4T score as a continuous variable to predict SRA positive HIT was 0.659 (95% CI 0.516 - 0.802; p = 0.041), and the area under ROC curve for HPF4-RA to predict SRA positive HIT was 0.818 ( 95% CI 0.712 - 0.924; p = 0.00) (Figure 1). HPF4-RA test also showed better overall prediction parameters for HIT as shown in Table 1. A combination of HIT HPF4-RA positive result and a 4T score ≥ 4 did not increase the area under ROC curve for prediction of SRA positive HIT.
Predictive performance of 4T's score and HPF4-RA for HIT (defined by positive SRA)
| . | Sensitivity (95% CI) . | Specificity (95% CI) . | PPV (95% CI) . | NPV (95% CI) . | Number of patients (%) . |
|---|---|---|---|---|---|
| 4T's score ≤ 3 (Low Risk) | 0.31 (0.11 – 0.59) | 0.72 (0.64 - 0.79) | 0.11 (0.03 - 0.23) | 0.91 (0.84 - 0.95) | 56 (44.8) |
| 4T's score ≥ 4 (Intermediate and High Risk) | 0.69 (0.41-0.89) | 0.39 (0.29 - 0.48) | 0.14 (0.72 - 0.24) | 0.89 (0.77 - 0.96) | 69 (55.2) |
| 4T's score ≥ 6 (High Risk) | 0.37 (0.15-0.65) | 0.82 (0.74 - 0.89) | 0.24 (0.09 - 0.45) | 0.90 (0.82 - 0.95) | 17 (13.6) |
| HPF4-RA Test | 0.88 (0.62-0.98) | 0.86 (0.81- 0.90) | 0.26 (0.16 - 0.41) | 0.99 (0.96 - 0.99) | 283 |
| PPV: Positive Predictive Value. NPV: Negative Predictive Value | |||||
Receiver Operating Characteristics (ROC) curve of the 4T's score and HPF4-RA test result for determining the presence of HIT (defined by positive SRA).
Receiver Operating Characteristics (ROC) curve of the 4T's score and HPF4-RA test result for determining the presence of HIT (defined by positive SRA).
Conclusions: Both 4T's score and HPF4-RA testing predict SRA positive HIT more than chance; however HPF4-RA testing predicts SRA positive HIT better than 4T's scores with higher sensitivity, specificity and NPV. This result challenges the pretesting algorithm for selecting patients for confirmatory SRA testing to diagnose HIT. Instead of using 4T's score as a screening tool for selecting patients for HPF4 antibody testing; rapid HPF4 antibody assays when available, should be considered as upfront screening tool and positive results considered for confirmatory SRA testing for diagnosis of HIT. Further studies are warranted to confirm this data.
No relevant conflicts of interest to declare.
Author notes
Asterisk with author names denotes non-ASH members.


This feature is available to Subscribers Only
Sign In or Create an Account Close Modal