Abstract

Background: Aberrant epigenetic modifications, fundamental to the pathogenesis of MDS, provide rationale for the use of the so-called hypomethylating agents, decitabine (DAC) and azacitidine (AZA). As depletion of DNA methyltransferase 1 (DNMT1) by these agents is S-phase dependent, episodic dosing used in common practice (SD-DAC; 20 mg/m2 x 5 days, every 28 days, SD-AZA; 75 mg/m2 x 5-7 days, every 28 days) affects only a fraction of the malignant clones. Alternative dosing schedules of decitabine with lower doses given more frequently (LD-DAC; .1-.2 mg/kg SC once/twice weekly) may decrease toxicity and increase response rates by improved hematopoietic differentiation and DNMT1 depletion while avoiding cytotoxicity. Data comparing use of very low and standard-dose DAC or AZA are lacking.
Methods: We compared response, survival, and toxicities of 242 MDS patients (pts) treated at our institution from 9/06-10/13 with LD-DAC (n=39), SD-DAC (n=17), or SD-AZA (n=186). Response was assessed per International Working Group 2006 (IWG) criteria, progression-free (PFS) from date of response, and overall survival (OS) from diagnosis.
Results: There were no significant differences in baseline characteristics, including median age (70 vs. 74 years, P=.93), proportion of patients with ≥5% bone marrow blasts (27% vs. 35%, P=.54), high/very high cytogenetic risk by the Revised International Prognostic Scoring System (IPSS-R, 25% vs. 40%, P=.31), number of pts with comorbidities (44% vs. 29%, P=.38), median time from diagnosis to treatment (14.6 vs. 6.4 months, P=.25) or prior MDS treatment (AZA and/or lenalidomide, 46% vs. 53%, P=.17), between the LD-DAC and SD-DAC groups, respectively. Likewise, the LA-DAC and SD-AZA groups were similar with respect to median age (70 vs. 68 years, P=.15), proportion of patients with ≥5% bone marrow blasts (27% vs. 39%, P=.19), and high/very high cytogenetic risk by the IPSS-R (25% vs. 27%, P=.83). However, pts in the SD-AZA group had a shorter median time from diagnosis to treatment (2.9 vs. 14.6 months, P=.009) compared to LD-DAC.
Median treatment duration was longer in LD-DAC pts compared to SD-DAC (9.1 vs. 3.1 months, P=.0008) with a median cumulative dose of 8.4 mg/kg (range 1.2-41.2) and 350 mg/m2 (range 175-975) for LD-DAC and SD-DAC, respectively. Compared to SD-DAC, the LD-DAC group required more frequent dose reductions/delays (67% vs. 20%, P=.004) and experienced more hematologic toxicity (85% vs. 29%, P< .0001), respectively.
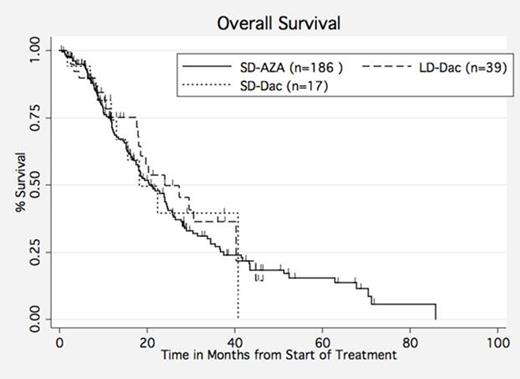
While median time to best response was similar for LD-DAC and SD-DAC (3 vs. 4.1 months, P=.52) there was a trend for higher IWG response rates (30% vs. 18%, P=.06) and lower disease progression rates (18% vs. 41%, P=.06) for LD-DAC compared to SD-DAC. However, this did not translate into a difference in median PFS (11 vs. 7.6 months, P= .34) or OS (23.9 vs. 18.2 months, P=.64, Figure 1). Comparing these results to SD-AZA, while LD-DAC had a longer median treatment duration (9.1 vs. 5.1 months, P=.052) and shorter median time to best response (3 vs. 5.3 months, P=.005) than SD-AZA, response rates were similar (30% vs. 31%, P=.5) and there were no significant differences with respect to median PFS (11 vs. 7.1 months, P=.059) or OS (23.9 vs. 21.1 months, P=.5, Figure 1).
Conclusion: Pts treated with the LD-DAC strategy have a response rate at least equivalent to SD-DAC and SD-AZA, though they required more dose adjustments and receive treatment for a longer time period. Survival was similar for all dosing strategies. Very low-dose DAC is an active treatment approach and will be compared to standard-dose DAC and AZA in an upcoming randomized, prospective trial conducted through the MDS Clinical Research Consortium.
Off Label Use: Subcutaneous administration of very low-dose decitabine in treatment of MDS .
Author notes
Asterisk with author names denotes non-ASH members.

This icon denotes a clinically relevant abstract


This feature is available to Subscribers Only
Sign In or Create an Account Close Modal