Abstract
Introduction: Immune thrombocytopenia (ITP) is an autoimmune disorder characterized by low platelet counts due to accelerated platelet destruction and impaired platelet production. Thrombopoietin (TPO) is the major regulator of platelet production, and TPO mimetics have been approved to treat patients with ITP with a response rate around 80%. In this study, we assessed the impact of eltrombopag on patients at the RNA level and explored the biological mechanisms underlying the variations in individual responses through blood transcriptome profiling analysis.
Methods: Peripheral blood specimens were collected for RNA extraction from patients with ITP at three time points: pre-treatment, one-week into treatment, and one-month into treatment. The criteria for response assessment are modified from the 2009 IWG guideline. The 3′-end RNA sequencing for expression quantification (3SEQ) was performed on 112 specimens from 37 patients. A globin-reduction approach was utilized for 77 samples with adequate RNA quantity to increase detection sensitivity. Sequencing data was mapped to human reference transcriptome to generate gene expression profiles. Using globin-reduced samples, SAMSeq analysis were conducted to identify differentially expressed genes. The pathways and upstream regulators associated with these genes were recognized using IPA (Ingenuity Pathway Analysis). With selected platelet specific genes as surrogate markers, post-treatment platelet gene expression- and platelet count-normalized platelet gene expression were compared with the pre-treatment expressions for each patient to assess platelet production and life span. In addition, the genomic coding regions of MPL (myeloproliferative leukemia virus oncogene) gene, encoding the receptor of TPO, were amplified by PCR and screened by Sanger sequencing for mutations in 10 responders and 7 nonresponders to assess for possible associations with drug responses.
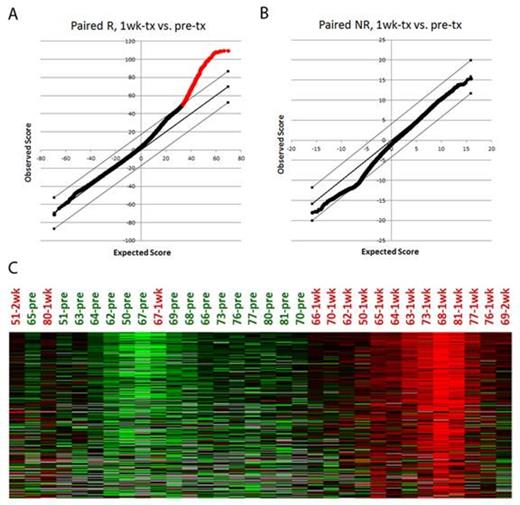
Results: No gene was identified as statistically significant to differentiate the responders and nonresponders at the pretreatment time point. No genetic variant within the coding regions of MPL was identified to be associated with the response to treatment. Along with the increased platelet counts at one-week into treatment, paired pretreatment and one-week into treatment analysis reveals TPO mimetics-induced upregulation of 215 genes in TPO responders (Figure 1A shows the SAM plot of SAMSeq two class paired comparison of 16 responders treated with eltrombopag at pretreatment and 1-week into treatment points, indicating a set of genes were upregulated at 1-week into treatment point. Figure 1C shows a heatmap of treatment-induced genes at baseline and after 1 week of eltrombopag treatment). On the contrary, nonresponders share no genes with statistically significant changes at one-week into treatment (Figure 1B). Interestingly, at one-month into treatment, responders show decreased expressions of the treatment-induced genes, even though the platelet counts are further elevated compared to the one-week into treatment time point. In responders, platelet gene expression was significantly increased at both one-week (p = 0.009) and one-month (p = 0.032) into treatment points, reflecting increased platelet production. Moreover, compared to the one-week into treatment time point, responders showed significantly reduced platelet count-normalized gene expression level (p = 0.033) at the one-month into treatment time point, indicating longer platelet life span and suggesting decreased platelet turnover rate. Pathway analysis identified TPO, GATA1 (GATA binding protein 1), and TGFB1 (transforming growth factor, beta1) as the top three activated upstream regulators for the treatment-induced genes.
Conclusions: These results suggest that the TPO mimetics may exert dual effects in responders: stimulation of platelet production, as well as ameliorate platelet destruction, possibly involving TGFB1 pathway and regulatory T cells.
SAMSeq analysis reveals treatment-induced gene expression in responders.
SAMSeq analysis reveals treatment-induced gene expression in responders.
Bussel:Shionogi: Research Funding; GlaxoSmithKline: Equity Ownership, Membership on an entity's Board of Directors or advisory committees, Research Funding; Amgen: Equity Ownership, Membership on an entity's Board of Directors or advisory committees, Research Funding. Zehnder:GlaxoSmithKline: Research Funding.
Author notes
Asterisk with author names denotes non-ASH members.


This feature is available to Subscribers Only
Sign In or Create an Account Close Modal