Abstract
Background
Serum Beta-2 microglobulin (B2M) has been proposed as a potential prognostic factor for Non Hodgkin Lymphomas, including diffuse large B cell lymphoma (DLBCL). However, its prognostic value in DLBCL is not well known in rituximab era. We aimed to investigate its role as a prognostic factor in patients with DLBCL treated with R-CHOP (rituximab, cyclophosphamide, doxorubicin, vincristine, and prednisone)
Method
Between January 2004 and April 2014, 940 patients with DLBCL, newly diagnosed and treated with R-CHOP, were identified in a single center lymphoma registry. Baseline serum B2M was available in 834 of these patients. Progression-free survival (PFS) and Overall survival (OS) was compared according to the levels of B2M using log-rank test.
Result
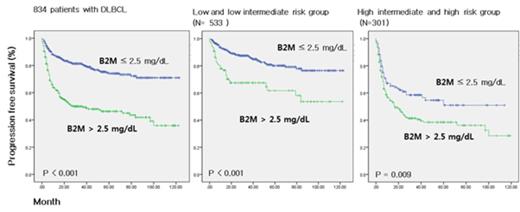
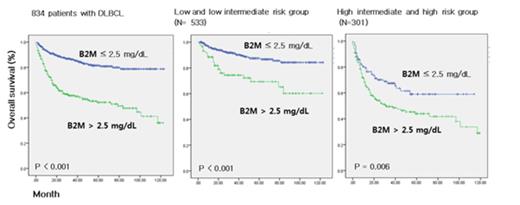
Median B2M value was 2.1 (range, 0.67-29.6 mg/L) and baseline value was elevated (> 2.5 mg/L) in 269 patients (32%). Elevated serum B2M was significantly associated with poor prognostic factors, as summarizedin table 1. In univariate analysis, elevated B2MG was significantly associated with poor PFS (hazard ratio [HR]=3.0, 95% confidence interval [CI]: 2.4-3.9; P <0.001) and OS (HR=3.5, 95% CI: 2.6-4.6; P <0.001). Each elements of IPI, high intermediate or high risk group of IPI, accompanying B symptoms, and bone marrow (BM) involvement were associated with shorter PFS and OS, also. We performed multivariate analyses to establish the prognostic role of B2M with confounding variables inlucidng sex, existence of B symptoms, Han's classification, BM involvement, bulky disease, risk groups according to IPI, revised IPI and National Comprehensive Cancer Network (NCCN)-IPI using three different models to avoid multicollinearity problem, each including IPI, revised IPI and NCCN-IPI. With adjustment for IPI, elevated B2M was demonstrated as a significant prognostic factor for PFS (HR=1.9, 95% CI: 1.3-2.6; p<0.001) and OS (HR=2.1, 95% CI: 1.4-3.0; p<0.001). After adjustment for revised IPI and NCCN-IPI with above confounding factors, elevated B2M still maintained statistical significance in PFS and OS, respectively (Table 2). The relevance of prognostic value of serum B2M in different risk groups by IPI was shown in subgroup analysis. Serum B2M was significantly associated with PFS and OS in both lower-risk group (IPI, 0-2) and higher-risk group (IPI, 3-5) (Figure 1)
Conclusion
In conclusion, elevated serum B2M seems to be an independent prognostic factor in patients with DLBCL who were treated with R-CHOP, which warrants further validation.
Relationship between B2M and baseline patient characteristics
| Characteristics . | B2MG ¡Â2.5 mg/L, N (%) . | B2MG >2.5 mg/L, N (%) . | P value . |
|---|---|---|---|
| Age. Years <60 ¡Ã60 | 363 (44) 202 (24) | 100 (12) 169 (20) | <0.001 |
| Sex Male Female | 303 (36) 262 (31) | 174 (21) 95 (11) | 0.003 |
| ECOG 0 – 1 2 – 4 | 545 (65) 20 (2) | 216 (26) 53 (6) | <0.001 |
| Serum LDH Normal Elevated | 367 (44) 198 (24) | 64 (8) 205 (25) | <0.001 |
| Ann Arbor stage I - II III – IV | 339 (41) 225 (27) | 53 (6) 216 (26) | <0.001 |
| Number of extranodal sites 0-1 ¡Ã2 | 417 (50) 148 (18) | 113 (13) 156 (19) | <0.001 |
| B symptoms Yes No | 76 (9) 109 (13) | 489 (59) 160 (19) | <0.001 |
| Han's classification Germinal center B cell-like Activated B cell-like | 165 (20) 302 (36) | 62 (7) 162 (19) | 0.045 |
| BM involvement No Yes | 512 (61) 51 (6) | 192 (23) 77 (9) | <0.001 |
| Bulky disease No Yes (> 10 cm) | 530 (64) 35 (4) | 241 (29) 28 (3) | 0.031 |
| IPI Low/low-intermediate (0-1)/(2) High-intermediate/high (3)/(4-5) | 445 (53) 120 (14) | 88 (11) 181 (22) | <0.001 |
| Revised IPI Very good (0) Good (1-2) Poor (3-5) | 188 (23) 257 (31) 120 (14) | 6 (1) 82 (10) 181 (22) | <0.001 |
| NCCN-IPI Low (0-1) Low-intermediate (2-3) High-intermediate (4-5) High (¡Ã6) | 144 (17) 286 (34) 104 (12) 31 (4) | 6 (1) 65 (8) 122 (15) 76 (9) | <0.001 |
Multivatiate analysis for the association with serum B2M with PFS and OS
| Variables . | PFS HR (95% CI ) . | P value . | OS HR (95% CI) . | P value . |
|---|---|---|---|---|
| B2MG (>2.5 mg/dL) | 1.9 (1.3-2.6) | <0.001 | 2.1 (1.4-3.0) | <0.001 |
| IPI 0-2 3-5 | 1.0 3.0 (2.1-4.1) | <0.001 | 1.0 3.4 (2.3-5.0) | <0.001 |
| B2MG (>2.5 mg/dL) | 1.7 (1.2-2.3) | 0.002 | 1.9 (1.3-2.8) | <0.001 |
| Revised IPI 0 1-2 4-5 | 1.0 3.1 (1.6-6.0) 7.5 (3.8-14.8) | 0.001 <0.001 | 1.0 2.5 (1.2-5.4) 7.1 (3.3-15.4) | 0.019 <0.001 |
| B2MG (>2.5 mg/dL) | 1.6 (1.2-2.3) | 0.003 | 1.8 (1.3-2.7) | 0.002 |
| NCCN-IPI 0-1 2-3 4-5 ¡Ã6 | 1.0 1.9 (1.0-3.7) 3.3 (1.7-6.5) 8.7 (4.4-17.9) | 0.048 <0.001 <0.001 | 1.0 2.6 (1.1-6.1) 5.0 (2.1-12.0) 12.3 (5.0-30.4) | 0.032 <0.001 <0.001 |
Impact B2M in lower-risk and higher-risk group of patients with DLBCL by IPI
No relevant conflicts of interest to declare.
Author notes
Asterisk with author names denotes non-ASH members.


This feature is available to Subscribers Only
Sign In or Create an Account Close Modal