Abstract
Introduction: Ruxolitinib is a JAK 1/2 inhibitor approved in patients with myelofibrosis (MF). The safety profile is well characterized with anemia being a common adverse event. The aim of this mathematical modeling analysis is to characterize individual hemoglobin (Hb) dynamics during ruxolitinib treatment, and to establish a dose-response relationship between treatment and occurrence of an anemic event as defined by an on-treatment reduction in Hb to < 8g/dL.
Methods: Hb values from MF patients collected during first 24 weeks of treatment in 2 trials (INCB 18424-251 & COMFORT-I) were used to build a mathematical dose-Hb model while data from a third trial (COMFORT-II) was used to independently validate this model. These trials have previously characterized that mean Hg reached a nadir 8 to 16 weeks from start of treatment, then stabilized or improved (Verstovsek et al., 2010 and 2012; NEJM. Harrison et al, 2012; NEJM). Observed data were fitted via a non-linear-mixed-effect model (NONMEM VII) to characterize individual trends and inter-patient variability in the dynamics of Hb versus time and daily dose. A mechanistic model was used assuming stable Hb and 5 hypothetical compartments representing the life span of reticulocytes and red blood cells, the main carriers of Hb. Blood transfusions were modeled as bolus of Hb with a different elimination rate than Hb synthetized by patients with myelofibrosis. In order to quantify the probabilities of observing at least one anemia event (Hb < 8g/dL) for different starting doses, Hb levels were predicted from the final model based on dose levels from 10 to 25 mg bid for 24 weeks assuming no dose changes and no transfusions.
Results: Data from 421 patients including 4849 Hb values during the first 24 weeks of treatment were used to build the model and 1254 Hb values from 146 patients to validate it. The final model characterized Hb dynamics and established a dose-response relationship between ruxolitinib and on-treatment Hb concentrations. The model predicts a 19% higher probability of observing at least one anemia event for 25 mg bid compared to 10 mg bid during the first 24 weeks of ruxolitinib assuming no dose changes and no transfusions.
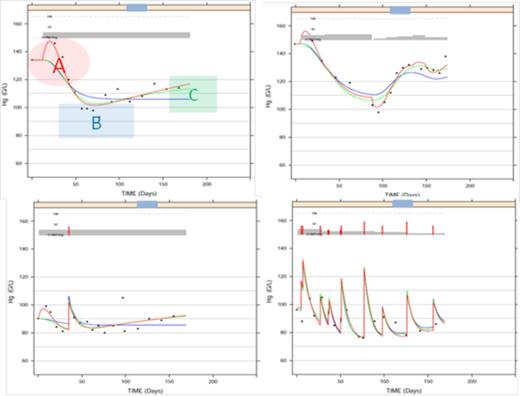
Model building was guided by an observed transient improvement in the Hb values during the first 4 weeks of ruxolitinib treatment (A), followed by a drop in Hb (nadir) during the next 3-4 weeks (B) and then a gradual trend upwards (C) in the observed Hb concentrations towards baseline values over the next few months of continued treatment (Figure 1). An initial model included the JAK 1/2 inhibitor effect on Hb precursor synthesis rate (k-in). It captured the data well overall, but low Hb values at nadir (B) were overestimated. A natural negative feedback loop between circulating Hb and kin helped overcome the bias. Additional effects of ruxolitinib on ‘k-in’ and the Hb elimination rate, ‘k-out’, that accounted for the early (A) and late (C) increases in Hb also improved fitting of the nadir (B). Finally only the final model with a complex mechanism of action involving both positive and negative effects on Hb dynamics was adequate to fit the data. 1000 simulated replicas of the independent validation data from the COMFORT-II trial were used to derive individual Hb profiles versus time and compute the proportion of patients with at least one anemia event (< 8 g/dL). Consistency of the simulated 95% CI with the observed proportion from COMFORT-II confirmed predictability of the final model.
Conclusions: The model provided a mechanistic capture of Hg changes and a return toward baseline Hg from the earlier nadir. Through this experimental model, we were able to establish a dose-response relationship which facilitates prediction of on-treatment Hb concentrations over time. Further investigations using prospective models alongside correlations with other treatment effects may be warranted to enable adapting this work into treatment management decisions while recognizing the transient nature of anemia events.
Fittings are shown in solid lines: Blue line- fitting with Hg decrease component only (B), Green line- Fitting with Hg decrease (B) + return to baseline (C), Red line- Final model fitting capturing all 3 characteristics (A+B+C).
Plot of observed dosing history (mg, gray bars), transfusions (g/L, red spikes), and Hb (g/L, dots) over time (day) illustrating the three characteristics of data (A, B and C) in 4 patients.
Plot of observed dosing history (mg, gray bars), transfusions (g/L, red spikes), and Hb (g/L, dots) over time (day) illustrating the three characteristics of data (A, B and C) in 4 patients.
Sarr:Novartis: Employment. Urva:Novartis: Employment. Nedelman:Novartis: Employment, Equity Ownership. Sallas:Novartis: Employment, Equity Ownership. Stalbovskaya:Novartis: Employment, Equity Ownership. Gopalakrishna:Novartis: Employment. Habr:Novartis: Employment. Capdeville:Novartis: Employment.
Author notes
Asterisk with author names denotes non-ASH members.


This feature is available to Subscribers Only
Sign In or Create an Account Close Modal