Abstract

Background: Heart failure due to iron-induced cardiomyopathy is rare yet remains one of the leading causes of death in patients with β thalassemia. Using myocardial T2* (mT2*) cardiovascular magnetic resonance (CMR) to estimate myocardial iron burden has improved the management of cardiac siderosis. Myocardial T2* >20 ms is considered normal and as iron accumulates, mT2* reduces, with values <10 ms associated with an increased risk of heart failure. As reported by Carpenter et al (2011), a calibration for CMR R2* against atomic emission spectroscopy-measured myocardial iron concentration (MIC), showing a curvilinear relationship between R2* and MIC, actual MIC can now also be assessed and affords an additional efficacy measure for patients undergoing iron chelation therapy. In a previous post-hoc analysis of the 3-year EPIC (Evaluation of Patients’ Iron Chelation with Exjade®) cardiac substudy, the long-term effects of deferasirox on mT2* and MIC were reported. Here, we report relative trends between mT2* and MIC as a representation of myocardial chelation efficacy by determining how far the patient has progressed from baseline toward reaching normal levels, in order to further understand the interpretation of these two parameters.
Methods: Patients aged ≥10 years with mT2* >5 to <20 ms by CMR, left ventricular ejection fraction ≥56%, serum ferritin >2500 ng/mL, MR (R2) liver iron concentration >10 mg Fe/g dry weight (dw) and ≥50 lifetime transfused blood units were included in the study. Cardiac iron removal was analyzed over 3 years in patients with mT2* at baseline and each considered time point. Post-hoc calculation of MIC from mT2* values was conducted using the formula described by Carpenter et al as follows: [Fe] = 45.0 x (mT2*)−1.22 where [Fe] is measured in milligrams per gram dw and mT2* is measured in milliseconds. Data are presented descriptively as the percentage of the progression of the patients toward achieving normalization of mT2* (>20 ms) or MIC (>1.16 mg Fe/g dw as derived from the formula based on normal mT2*) by mT2* at baseline: >5 to <10 ms, 10 to <15 ms and 15 to <20 ms.
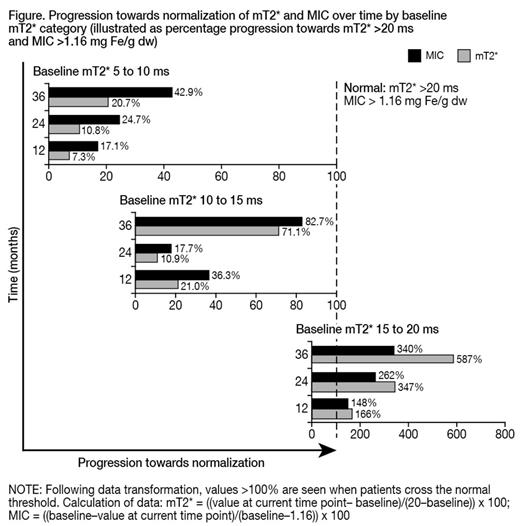
Results: Data were analyzed at Month 12 (n=67: baseline mT2* >5 to <10 ms, n=24; 10 to <15 ms, n=19; 15 to <20 ms, n=24), Month 24 (n=66: baseline mT2* >5 to <10 ms, n=24; 10 to <15 ms, n=18; 15 to <20 ms, n=24) and Month 36 (n=63: baseline mT2* >5 to <10 ms, n=22; 10 to <15 ms, n=18; 15 to <20 ms, n=23). As previously reported (Pennell et al. 2012), geometric mean mT2* in the overall population significantly increased from 12.0 ms at baseline to 13.9 ms at Month 12, 15.6 ms at Month 24 and 17.1 ms at Month 36. In parallel, mean MIC significantly decreased from 2.43 mg Fe/g dw at baseline to 2.10 mg Fe/g dw at Month 12, 1.94 mg Fe/g dw at Month 24 and 1.80 mg Fe/g dw at Month 36. The median percentage progression of patients towards normalizing mT2* and MIC by baseline mT2* category are presented in the Figure. In patients with severe myocardial iron overload at baseline, the percentage toward normalization in mT2* in the first, second and third year was less than the percentage towards normalization in MIC. This difference was less pronounced, but still evident, in patients with mild-to-moderate myocardial iron overload.
Discussion: The calibration of the relationship between CMR measurements and MIC by Carpenter et al allows an additional assessment to mT2* to determine chelator efficacy in terms of the actual concentration of iron in the myocardium. Here we show that, particularly in patients with severe myocardial iron overload, when analyzing the progression towards normalization, improvement in MIC is proportionally greater than that seen with mT2*. It could be interpreted that a small improvement (ie 1 ms) in mT2* when baseline values are >5 to <10 ms is not equivalent in terms of myocardial iron removal to a small improvement in patients with less severe myocardial iron overload at baseline; a consequence of the reciprocal relationship between mT2* and MIC. Therefore, analysis of mT2* only may underestimate the efficacy of iron chelation with respect to the myocardium in patients with severe myocardial iron loading (mT2* <10 ms) and thus MIC may better reflect response to chelation therapy. It would therefore be valuable if MIC were calculated and reported in parallel with mT2* when assessing and monitoring patients on iron chelation therapy across a range of baseline mT2* values.
Porter:Novartis: Consultancy, Honoraria, Research Funding; Shire: Consultancy, Honoraria; Celgene: Consultancy; Cerus: Membership on an entity's Board of Directors or advisory committees; Alnylam: Membership on an entity's Board of Directors or advisory committees. Taher:Novartis: Honoraria, Research Funding. Aydinok:Novartis: Membership on an entity's Board of Directors or advisory committees, Research Funding, Speakers Bureau. El-Ali:Novartis: Employment. Barbier:Novartis: Employment. Cappellini:Novartis: Honoraria, Speakers Bureau; Genzyme: Honoraria.
Author notes
Asterisk with author names denotes non-ASH members.

This icon denotes a clinically relevant abstract


This feature is available to Subscribers Only
Sign In or Create an Account Close Modal