Abstract
Introduction We have evaluated Antithrombin (AT) values and Whole Blood Rotation Thromboelastometry (ROTEM) profiles in children affected by acute lymphoblastic leukemia (ALL), followed at the Clinic of Pediatric Hematology Oncology of Padua. L-Asparaginase, used in protocols for pediatric ALL, is an inhibitor of protein synthesis. Typical collateral effects are coagulation disturbances. Guidelines for identification of patients at risk of thrombosis and hemorrhages are not yet established. AT levels are the only reliable parameter for thrombotic risk. Very low levels of fibrinogen are not correctly detected by classical Clauss method; ROTEM test using FIBTEM is considered a valid tool to identify hypofibrinogenemia and hemorrhagic risk in surgical patients. The aim of the study was to analyze coagulation patterns during treatment with Pegilated L-Asparaginase (Peg-Asp).
Methods Forty-two children (25 males, 17 females; 31 pB-ALL; 11 T-ALL; 23 at standard/medium risk; 19 at high risk) were consecutively diagnosed and treated with AIEOP BFM ALL 2009 protocol from June 2012 to March 2014. They received 3 (standard/medium risk) or 8 (high risk) doses of Peg-Asp (2500UI/mq/dose). ROTEM and AT determinations were performed at 5 fixed time-points before and after each Peg-Asp administration. Prothrombin time (PT), fibrinogen plasma levels and platelets counts were recorded. Maximum Clot Firmness (MCF; normal value 9-25 mm), measuring the maximum amplitude reached in FIBTEM thromboelastogram, assessed the specific role of fibrinogen in the whole blood clot formation following platelets inhibition by Cytocalasin D.
Results: 798 AT and 706 FIBTEM tests were performed; details are reported in Table. We divided abnormal MCF in 3 grade levels. Only values of MCF >9 mm had a linear correlation with fibrinogen levels. Plasma fibrinogen values <1 g/l were seen only in 45/286 (15%) cases with low MCF, without the possibility to discriminate the 3 MCF groups. Hemorrhagic risk was not suggested by PT, which was highly prolonged only in 5 cases (MCF 4-8 mm). Supplementation with AT or fibrinogen concentrates was suggested for patients with AT <50% or MCF <2 and decided on clinical basis.
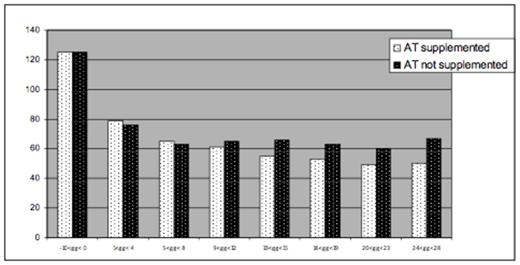
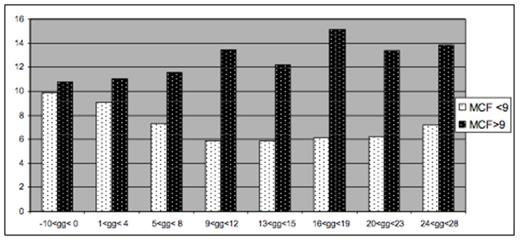
Twenty six children had a complete set of tests available during Induction phase (2 doses of Peg-Asp). They showed two different patterns of AT and MCF behavior. In 13 patients, mean AT levels decreased until 12-14 days after Peg-Asp, never being <50% and increased thereafter. The other thirteen patients had low AT levels from day 12 after Peg-Asp, required supplementation even before the second dose of Peg-Asp and did not show recovery until the forth week after treatment (figure 1). In 11 patients , MCF were never <9mm , without any trend to reduction. In 15 patients, who had at least 2 tests of MCF <9mm, mean MCF decreased regularly from first Peg-Asp dose until day 21, showing a trend to recovery at day 28 (figure 2).
One child had a cerebral sinus thrombosis at the end of induction; one child had extensive thrombosis, strongly related to the central line used for dialysis. Thromboses were not related to fibrinogen concentrates administration or low AT levels. No bleedings were observed.
Conclusions: Extensive analysis of coagulation parameters in children undergoing chemotherapy for ALL containing PEG Asp showed abnormalities of AT in 88% of patients and of MCF in 30%. These tests identified patients with significant abnormalities more closely than classical methods. Careful use of AT dosage and FIBTEM can help in managing coagulation disturbances, by identifying patients at risk and suggesting prevention measures.
AT and FIBTEM analysis in ALL patients
| Total N. pts / total N. tests . | |||
|---|---|---|---|
| AT | 42/798 | MCF | 42/706 |
| Pts with pathological tests | |||
| AT<50% | 37 (88%) | MCF<9mm | 13 (30%) |
| N. of Pathological tests | |||
| AT<50% | 158 (19%) | MCF<9 mm | 286 (40%) |
| MCF 5-9 mm | 212 (30.5%) | ||
| MCF 3-4 mm | 56 (7%) | ||
| MCF <2 mm | 18 (2.5%) | ||
| Supplementation with AT or FC | |||
| AT<50% | 58 units in 24 pts | MCF<2 mm | 18 units in 11 pts |
Mean AT levels in ALL patients during induction (according to AT supplementation)
Mean AT levels in ALL patients during induction (according to AT supplementation)
Mean MCF levels in ALL patients during induction (MCF>9 and MCF <9mm)
No relevant conflicts of interest to declare.
Author notes
Asterisk with author names denotes non-ASH members.


This feature is available to Subscribers Only
Sign In or Create an Account Close Modal