Abstract
The clinical management of patients with acute lymphoblastic leukemia (ALL) relies on accurate prediction of relapse hazard to determine the intensity of therapy and to avoid over- or under- treatment. Minimal residual disease (MRD) is a very effective method for predicting response to treatment and potential relapse in patients with ALL. The most validated method used to assess MRD in ALL is flow cytometric (FCM) analysis of leukemia-associated immunophenotypes which can detect up to 1 leukemic cell per 10,000 normal cells (0.01%). There is no standard method for detecting MRD by FCM in ALL patients. Our institutional approach has been to evaluate 20,000- 50,000 events using a specific immunophenotypic panel and to analyze the data using WinList software with a concurrent comparison with the diagnostic immunophenotype.
GemStone™ is a new data analysis program that uses a Probability State Modeling (PSM) approach to analyze FCM data. The incorporated TriCOM technology numerically correlates all the immunophenotype combinations which can be used to detect MRD and other rare populations.
In this study, we compared the GemStone and WinList analysis methods on the same patient data files. We identified 33 patients suitable for comparison by performing a retrospective review of the medical records from 2004-2010 in our pre-B cell ALL database. Patients were newly diagnosed, untreated, age ≥17 years and had FCM data available at diagnosis, week 4 (range 3-8) and week 16 (range 12-20) post therapy. We analyzed the FCM files to detect MRD using both GemStone and WinList methods separately, we subsequently reviewed the clinical course of the patients and identified those who sustained complete remission or relapsed. The clinical and FCM results were statistically correlated in Chi Square 2x2 table to identify the predictive value of each analysis method.
WinList: we used CD10, CD19, CD34 and CD38 as a backbone marker set and tracked the same abnormal immunophenotype upon diagnosis in the subsequent follow up samples.
GemStone: We used the same marker set and incorporate the TriCOM technology identify the MRD numerically.
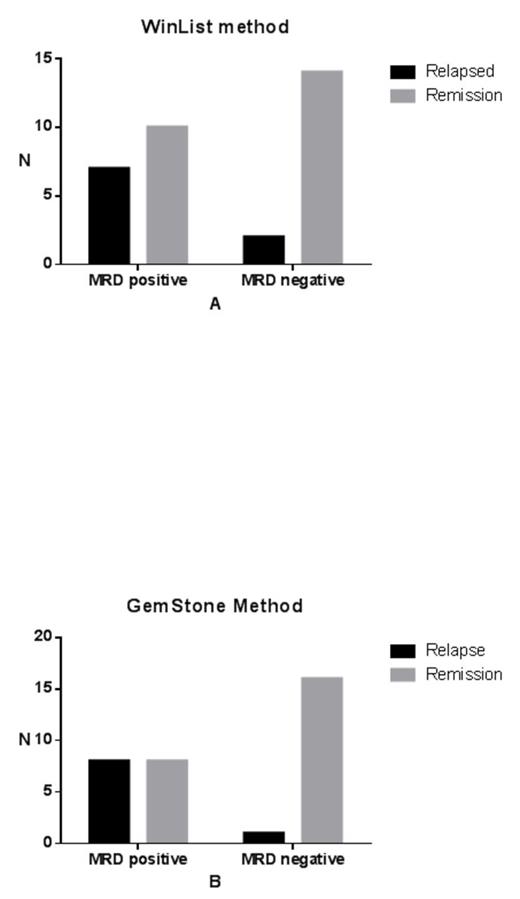
Figure 1 compares the outcome between GemStone and WinList methods at 16 weeks follow up.
Table 1 reviews Chi Square with both method of analysis which gives comparable results.
In summary, our retrospective review showed that GemStone method in detecting the MRD had comparable clinical and statistical significance to the WinList method. However, we found that the limited number of events collected (20,000) reduced our ability to completely automate the analysis process in GemStone due to intensity differences in the data. We are now conducting a prospective analysis by GemStone on ALL patients with higher number of collected events (5 x 10⁵- 2x 10⁶)
Further, in our review, the MRD at 4 months post diagnosis (average 12-20 weeks) was more clinically significant than the one at 4 weeks follow up (range 3-8 weeks).
A. Correlation between the clinical and FCM result using WinList method at 16 weeks follow up B. Correlation between the clinical and FCM result using GemStone method at 16 weeks follow up
A. Correlation between the clinical and FCM result using WinList method at 16 weeks follow up B. Correlation between the clinical and FCM result using GemStone method at 16 weeks follow up
Table 1: comparison between WinList and GemStone method.
| . | Sensitivity . | Specificity . | PPV . | NPV . | P value . | Statistically significant . |
|---|---|---|---|---|---|---|
| WinList at 4 week F/U | 33% | 58% | 23% | 70% | 0.49 | no |
| GemStone at 4 week F/U | 44% | 79% | 44% | 79% | 0.17 | no |
| WinList at 16 week F/U | 78% | 58% | 41% | 88% | 0.0323 | yes |
| GemStone at 16 week F/U | 89% | 67% | 50% | 94% | 0.0022 | yes |
Hill:Verity Software house: Employment. Griffiths:Astex Pharmaceuticals: Research Funding; Celgene, Incyte and Alexion: Honoraria.
Author notes
Asterisk with author names denotes non-ASH members.


This feature is available to Subscribers Only
Sign In or Create an Account Close Modal