Abstract
Introduction. It has been rarely reported that a laboratory test introduced so rapid and radical changes in diagnostic algorithm as is the case with the quantitative assay of free light chains of immunoglobulins (FLC) in serum and its role in the diagnostic algorithm of monoclonal gammopathies. Since the first description of immunoassay in year 2001 until today, new evidence has continuously been reported in the literature that confirm the clinical usefulness of this test in diagnosis, monitoring and prognosis of monoclonal plasma-proliferative diseases, especially diseases of light chains such as primary amyloidosis, light chain deposition disease (LCDD) or light chain multiple myeloma (LCMM) and nonsecretory multiple myeloma (NSMM). Recently, a commercial test has become available on the market that uses polyclonal antibodies to specific epitopes of free light chains which are hidden in the intact immunoglobulin molecules. In 2011, a commercial immunoassay was launched on the market that uses monoclonal instead of polyclonal antibodies, reducing the variability between different series of reagents and controlling excess antigen in the sample.
Aim. The aim of this study was to evaluate monoclonal versus polyclonal antibody and immunoturbidimetric versus immunonephelometric detection technology. Does different detection tehnology – besides different used antibody – contribute to greater variability in results?
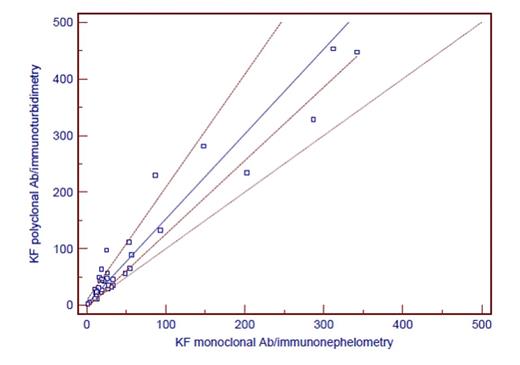
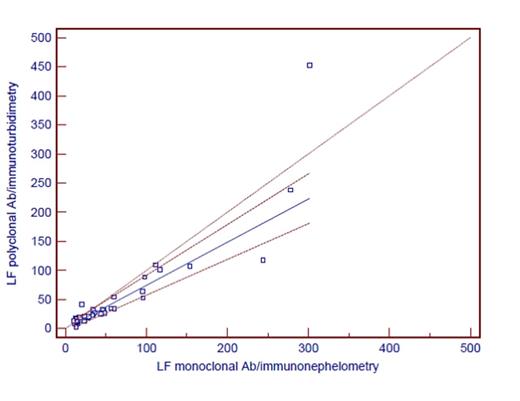
Method. In this study we compared results of 40 samples measured with polyclonal antibody (The Binding Site Ltd., Birmingham, UK) and monoclonal antibody (N Latex FLC, Siemens Healthcare Diagnostics, Marburg, Germany). In other 40 samples we compared results achieved with different antibodies and different analytical platforms (Siemens Nephelometer with Roche Cobas). Results were statistically analyzed using MedCalc software.
Results. Results are shown in Table 1. Comparing all results, it is evident that there is at least proportional error when comparing different antibodies and different analytical systems. Although it is known that immunoturbidimetry is less sensitive than immunonephelometric method, greater discrepancies in results were not found. When we categorized patients as positive and negative according to manufacturer's reference interval for kf/lf ratio, agreement between groups with different antibody and same detection technology was 63% (weighted kappa 0.30). Agreement between groups with different antibodies and different detection technology was 86% (weighted kappa 0.22). Although we have not measured the same samples when testing antibody and analytical platform, the selected analytical platform has, according to our results, no additional impact on the variability of results.
Comparison of FLC results using different antibody and different analytical platforms
| Method . | . | FLC kappa polyclonal Ab Nephelometer Siemens . | FLC kappa monoclonal Ab Nephelometer Siemens . | FLC lambda polyclonal Ab Nephelometer Siemens . | FLC lambda monoclonal Ab Nephelometer Siemens . |
|---|---|---|---|---|---|
| Results (min-max) | 6.59-5210.00 | 6.34-1600.00 | 1.67-3010.00 | 1.00-1600.00 | |
| Passing-Bablok fit | intercept (95% Cl) | 8.244 2.9255 to 14.9249 | 1.0945 -1.5910 to 5.5631 | ||
| slope (95% Cl) | 0.595 0.4564 to 0.7852 | 1.8798 1.5336 to 2.1045 | |||
| Correlation rs (p<0.0001) | 0.911 | 0.887 | |||
| Method | FLC kappa polyclonal Ab Cobas Roche | FLC kappa monoclonal Ab Nephelometer Siemens | FLC lambda polyclonal Ab Cobas Roche | FLC lambda monoclonal Ab Nephelometer Siemens | |
| Results (min-max) | 2.40-453.20 | 1.10-342.00 | 2.30-452.10 | 10.30-301.20 | |
| Passing-Bablok fit | intercept (95% Cl) | 2.622 -3.8207 to 9.3023 | 0.1585 -3.9731 to 4.5892 | ||
| slope (95% Cl) | 1.5 1.2972 to 1.9933 | 0.7416 0.6174 to 0.8708 | |||
| Correlation rs (p<0.0001) | 0.873 | 0.929 | |||
Conclusion. Physicians and especially clinical biochemists must be aware of the technical shortcomings of this test, such as the variability between different series (lots) reagents, non-linearity, unreliable detection of excess antigen and overestimation of FLC concentrations due to nonspecific interference or polymerization.
Although initial results are not discouraging, it will be necessary to collect much more evidence, especially bearing in mind that use of monoclonal antibodies along with advantages has certain disadvantages. In the future, it will probably be necessary to incorporate into the guidelines a recommendation to report the method used, like for other tumor markers.
No relevant conflicts of interest to declare.
Author notes
Asterisk with author names denotes non-ASH members.


This feature is available to Subscribers Only
Sign In or Create an Account Close Modal