Key Points
Megakaryocyte-specific Sp1/Sp3 double-knockout mice display thrombocytopenia, platelet dysfunction, and defects in megakaryocyte maturation.
Selective Mylk inhibition by ML7 affects proplatelet formation and stabilization and ITAM receptor–mediated platelet aggregation.
Abstract
Sp1 and Sp3 belong to the specificity proteins (Sp)/Krüppel-like transcription factor family. They are closely related, ubiquitously expressed, and recognize G-rich DNA motifs. They are thought to regulate generic processes such as cell-cycle and growth control, metabolic pathways, and apoptosis. Ablation of Sp1 or Sp3 in mice is lethal, and combined haploinsufficiency results in hematopoietic defects during the fetal stages. Here, we show that in adult mice, conditional pan-hematopoietic (Mx1-Cre) ablation of either Sp1 or Sp3 has minimal impact on hematopoiesis, whereas the simultaneous loss of Sp1 and Sp3 results in severe macrothrombocytopenia. This occurs in a cell-autonomous manner as shown by megakaryocyte-specific (Pf4-Cre) double-knockout mice. We employed flow cytometry, cell culture, and electron microscopy and show that although megakaryocyte numbers are normal in bone marrow and spleen, they display a less compact demarcation membrane system and a striking inability to form proplatelets. Through megakaryocyte transcriptomics and platelet proteomics, we identified several cytoskeleton-related proteins and downstream effector kinases, including Mylk, that were downregulated upon Sp1/Sp3 depletion, providing an explanation for the observed defects in megakaryopoiesis. Supporting this notion, selective Mylk inhibition by ML7 affected proplatelet formation and stabilization and resulted in defective ITAM receptor–mediated platelet aggregation.
Introduction
Platelets are the blood cells responsible for maintaining the body hemostasis and, in humans, ∼1011 platelets are produced by megakaryocytes daily.1 Megakaryopoiesis is the process whereby hematopoietic progenitor cells differentiate into mature megakaryocytes, which produce platelets in a process known as thrombopoiesis.2,3 This takes place at sites of primary hematopoiesis, ie, the bone marrow and, in mice, also in the spleen.4 The hormone thrombopoietin (TPO), produced by the liver, regulates platelet production. TPO levels in plasma are inversely proportional to the megakaryocyte/platelet mass.5 Megakaryocyte differentiation is characterized by highly specialized cellular changes including endomitosis (leading to polyploid cells), accumulation of α and dense granules, and development of a demarcation membrane system (DMS), which is required as a membrane reservoir to produce large numbers of platelets.2,3 Mature megakaryocytes migrate toward the proximity of blood vessels through which they protrude cytoplasmic microtubule-rich extensions into the blood stream, known as proplatelets, from which platelets are shed.6 Coordinated interactions between the membrane, cytoskeletal machinery and intracellular signaling are essential for proplatelet formation.3 These events are accompanied by extensive transcription and protein synthesis, and defects in one or more of these processes lead to qualitative or quantitative defects in platelets.3,7,8
Acquired or congenital thrombocytopenias, ie, low platelet counts,9 are caused by increased platelet destruction10 or by decreased platelet production.7,11,12 The causative mutations for some of the congenital thrombocytopenias, which present with bleeding symptoms, have been identified (ie, Glanzmann thrombasthenia, Bernard-Soulier syndrome).7,12-14 However, an increasing number of congenital thrombocytopenias of unknown etiology, asymptomatic with respect to bleeding, are currently diagnosed due to the routine use of automated blood counting.9 Increasing efforts worldwide are aimed at identifying the molecular mechanisms regulating megakaryopoiesis, including transcriptional programs, because not only coding mutations but also mutations in regulatory regions of genes could be involved in the development of inherited thrombocytopenias.15
Many studies have already pinpointed several transcription factors that play an essential role in megakaryopoiesis, such as GATA1,7,12,16-19 GFI1B,20 RUNX1,21 FLI1, NFE2, and TAL1.15,22-24
Sp1 and Sp3 belong to the family of specificity protein (Sp)/Krüppel-like factor (KLF), which recognize G-rich promoter elements (GC-box and the related GT-box) and are expressed in most mammalian cell types investigated to date.25,26 Sp1 knockout embryos are developmentally retarded and do not survive beyond embryonic day 10.5.27 Sp3 null embryos die shortly after birth due to complications including defects in hematopoiesis.28-30 Sp1/Sp3 compound heterozygous embryos are not viable and display impaired erythroid development, suggesting that a critical threshold of Sp1/Sp3 activity is required for normal embryonic development and that these 2 proteins have additive effects in regulating downstream target genes.31
To understand the role of Sp1 and Sp3 in the adult hematopoietic system, we generated mice with conditional knockout alleles for Sp1 and Sp3, which we crossed with the inducible pan-hematopoietic Cre line, Mx1-Cre.32 Sp1/Sp3 double-knockout animals showed a dramatic reduction in the number of circulatory platelets. Based on these findings, we used the Pf4-Cre line, which allows for gene excision in the megakaryocytic lineage,33 to investigate a cell-autonomous role of Sp1 and Sp3 in megakaryocyte and platelet development. Megakaryocyte-specific Sp1/Sp3 double-knockout mice display macrothrombocytopenia and platelet dysfunction. We studied megakaryopoiesis and platelet function in these mice and combined genome-wide transcriptomics and proteomics in order to reveal deregulated genes and their function during megakaryopoiesis.
Methods
Mice
Mice were maintained in the Erasmus MC or the Netherlands Cancer Institute animal care facilities under specific-pathogen-free conditions. All animal experiments were approved by the Erasmus MC and Netherlands Cancer Institute animal ethics committees.
Blood analysis
Blood was drawn by submandibular vein or heart puncture, and collected in heparin-coated vials. Blood parameters were determined on a scil Vet abc Plus+ instrument (Viernheim, Germany). Platelet-rich plasma was separated by centrifuging the blood 15 minutes at 50g. TPO levels in plasma were measured by mouse TPO immunoassay (R&D, Minneapolis, MN).
Platelet function assays
Flow chamber perfusion
Platelets were washed from platelet-rich plasma, and 108 platelets were resuspended in 200 μL of platelet-free blood + plasma 1:1 (5 × 10⁸ platelets/mL), which was perfused over a microslide (0.1 Luer; Ibidi, Martinsried, Germany) coated with 100 μL/mL collagen (Horm; Nycomed Arzneimittel, Munich, Germany) under arterial shear conditions (1500 m/s). Thrombi were labeled with 200 μL 2 nM carboxyfluorescein diacetate succinimidyl ester (CFSE; Invitrogen, Life Technologies, Carlsbad, CA) in phosphate-buffered saline, and images were taken at original magnification ×20 with an EVOS fluorescent microscope (AMG, Life Technologies). Coverage of adhered platelets was quantified using ImageJ software (8 images per sample).
Flow cytometry–based platelet aggregation assay (FCA)
FCA was performed as described previously.34 For further details, see supplemental Methods (available on the Blood Web site).
Tail bleeding time
Nonanesthetized mice were placed in a restraining device and 5 mm of the distal tail was cut. The tail was immersed in phosphate-buffered saline at 37°C, and bleeding time was measured from the moment of transection until first arrest of bleeding. If bleeding did not cease, observation was stopped at 120 seconds.
Flow cytometry
See supplemental Methods for details.
Histology
Spleen samples and N-2-hydroxyethylpiperazine-N′-2-ethanesulfonic acid (HEPES)–flushed bone marrow from mouse femora were embedded in Tissue-Tek (EMS, Hatfield, PA) and snap-frozen in liquid nitrogen. Bone marrow sections (5 μm) were cut using a cryostat and were subsequently stained with CD41-PE (BD Biosciences, San Diego, CA), CD31-FITC (R&D), and Phalloidin-CF633 (Biotium, Hayward, CA). Pictures were taken using a LSM510 confocal microscope equipped with an axiocam MRm (Zeiss, Oberkochen, Germany). Acetylcholinesterase staining on spleen sections was performed as described previously.35
In vitro culture
Bone marrow explants: proplatelet formation assay.
These were performed as previously described36 and specified in supplemental Methods.
Bone marrow–derived megakaryocyte cultures.
Bone marrow single-cell suspension was made by straining crushed femora through a 40 μm filter (BD Biosciences) and cultured in StemSpan (STEMCELL Technologies, Vancouver, BC, Canada) supplemented with 10% heat-inactivated fetal calf serum, penicillin/streptavidin, 2% low-density lipoprotein (Sigma-Aldrich, St. Louis, MO), 50 ng/mL recombinant human stem cell factor, 20 ng/mL TPO, and 1 U/mL erythropoietin at a concentration of 2 × 10⁶ cells/mL. Cells were washed at days 2 and 4 and an increasing concentration of TPO was added (ie, 50 ng/mL at day 2 and 100 ng/mL at day 4). At day 7, the cells were harvested.
Electron microscopy
Cultured megakaryocytes were fixed in Karnovsky’s fixative. Postfixation was done with 1% osmium tetroxide in 0.1 M cacodylate buffer. After washing, the pellets were stained en bloc with Ultrastain 1 (Leica, Wetzlar, Germany), followed by ethanol dehydration series. Finally, megakaryocytes were embedded in a mixture of DDSA/NMA/Embed-812 (EMS), sectioned and stained with Ultrastain 2 (Leica), and analyzed with a Philips CM10 electron microscope (FEI, Hillsboro, OR).
RNA and protein
See supplemental Methods for details.
Statistical analysis
We represent average and standard error of the mean (SEM) of at least 3 mice per genotype unless otherwise indicated. We applied 2-tailed Student t tests to calculate statistical significance (*P < .05; **P < .005; ***P < .001).
Results
Sp1::Sp3 dKO mice are macrothrombocytopenic with normal plasma TPO levels
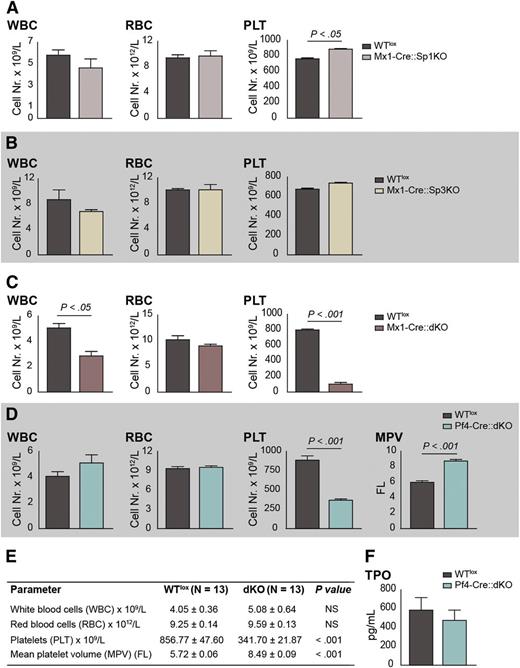
In order to evaluate the contribution of the Sp1/Sp3 transcription factors to adult hematopoiesis, Sp1fl/fl::Sp3fl/fl mice were crossed with Mx1-Cre mice32 and treated with polyinosinic:polycytidylic acid (poly IC) as described previously.16 Mx1-Cre::Sp1fl/fl::Sp3fl/fl (Mx1-Cre::dKO) mice displayed decreased white blood cell and platelet numbers, whereas Sp1fl/fl::Sp3fl/fl (WTlox) mice or single-knockout mice did not (Figure 1A-C). These results suggest an essential redundant role for Sp1/Sp3 in megakaryopoiesis. To further investigate this, and to establish that the observed thrombocytopenia was an intrinsic effect of Sp1/Sp3 deletion in the megakaryocytic lineage, we crossed the Sp1fl/fl::Sp3fl/fl with Pf4-Cre mice.33 For reasons of clarity, we will refer to the Sp1fl/fl::Sp3fl/fl control mice as WTlox, and the Pf4-Cre::Sp1fl/fl::Sp3fl/fl mice as double knockout (dKO) in the remainder of this paper. Survival of all lines generated was not affected up to 180 days, and they did not display spontaneous bleeding or any other major pathology. The mean blood platelet count was reduced by 60% and the mean platelet volume was increased 1.5-fold in dKO when compared with WTlox mice, whereas red blood cells and white blood cells were not affected (Figure 1D-E). These data show that dKO mice suffer from macrothrombocytopenia.
Sp1::Sp3 dKO mice display macrothrombocytopenia with unaltered megakaryocyte/platelet mass. (A) Blood parameters of Mx1-Cre::Sp1KO and WTlox mice at 12 weeks of age and after poly IC treatment. (B) Blood parameters of Mx1-Cre::Sp3KO and WTlox mice at 12 weeks of age and after poly IC treatment. (C) Blood parameters of Mx1-Cre::dKO and WTlox mice at 12 weeks of age and after poly IC treatment. (D) Blood parameters of Pf4-Cre::dKO and WTlox mice at 12 weeks of age (n = 13). (E) Table summarizing the blood parameters of Pf4-Cre::dKO and WTlox mice corresponding to panel D. (F) TPO levels in plasma of dKO and WTlox mice (n = 13). MPV, mean platelet volume; PLT, platelets; RBC, red blood cell; WBC, white blood cell.
Sp1::Sp3 dKO mice display macrothrombocytopenia with unaltered megakaryocyte/platelet mass. (A) Blood parameters of Mx1-Cre::Sp1KO and WTlox mice at 12 weeks of age and after poly IC treatment. (B) Blood parameters of Mx1-Cre::Sp3KO and WTlox mice at 12 weeks of age and after poly IC treatment. (C) Blood parameters of Mx1-Cre::dKO and WTlox mice at 12 weeks of age and after poly IC treatment. (D) Blood parameters of Pf4-Cre::dKO and WTlox mice at 12 weeks of age (n = 13). (E) Table summarizing the blood parameters of Pf4-Cre::dKO and WTlox mice corresponding to panel D. (F) TPO levels in plasma of dKO and WTlox mice (n = 13). MPV, mean platelet volume; PLT, platelets; RBC, red blood cell; WBC, white blood cell.
TPO levels in plasma of dKO and WTlox mice were similar (Figure 1F), suggesting that the macrothrombocytopenia is not due to a defect in TPO production and that the total megakaryocyte/platelet mass is not altered.
Normal number, ploidy, and distribution of megakaryocytes in bone marrow and spleen of dKO mice
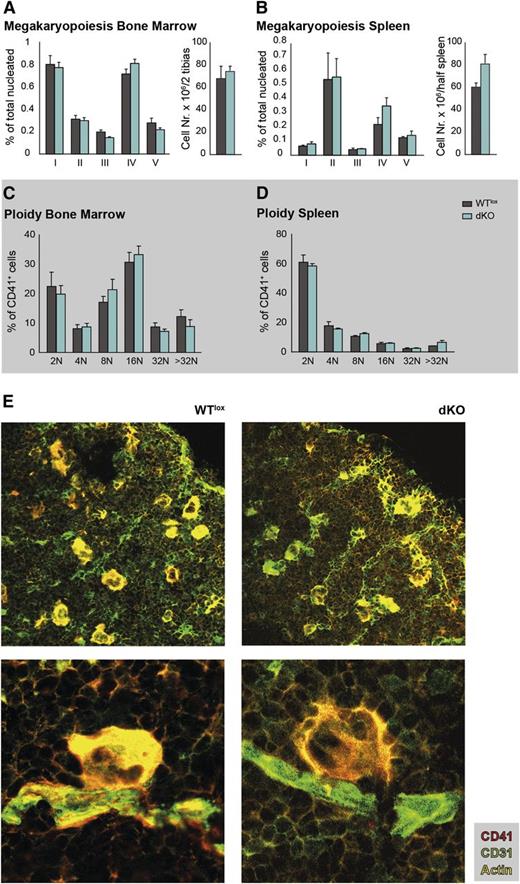
Flow cytometry analysis was performed to determine the percentage of megakaryocytes at consecutive differentiation stages (supplemental Figure 1A) in the bone marrow and spleen. In both tissues, no differences in the percentage of megakaryocyte precursors were noticed in dKO mice when compared with WTlox animals. Furthermore, the total cell numbers of bone marrow and spleen were not altered (Figure 2A-B). Histologic analysis of spleen sections using acetylcholinesterase staining to visualize megakaryocytes revealed no overt differences in their distribution and numbers within the splenic red pulp (supplemental Figure 1B). Collectively, this strongly suggests that commitment and expansion of megakaryocytes is not affected in dKO mice, and neither is TPO responsiveness.
Megakaryocyte differentiation, location and ploidy status are not affected in dKO mice. (A-B) Percentage of megakaryocytes at consecutive stages of differentiation (I-V, as detailed in supplemental Figure 1) of nucleated bone marrow and spleen cells, and total bone marrow and spleen cell counts. (C-D) Ploidy staining of CD41-positive bone marrow and spleen megakaryocytes (as detailed in supplemental Figure 2). (E) Representative images of bone marrow cryosections, immunostained with CD41-PE (megakaryocytes), CD31-FITC (megakaryocytes and endothelial cells), and Phalloidin-CF633 (actin) to visualize their location and proximity to blood vessels in the bone marrow. Low and high magnifications are shown.
Megakaryocyte differentiation, location and ploidy status are not affected in dKO mice. (A-B) Percentage of megakaryocytes at consecutive stages of differentiation (I-V, as detailed in supplemental Figure 1) of nucleated bone marrow and spleen cells, and total bone marrow and spleen cell counts. (C-D) Ploidy staining of CD41-positive bone marrow and spleen megakaryocytes (as detailed in supplemental Figure 2). (E) Representative images of bone marrow cryosections, immunostained with CD41-PE (megakaryocytes), CD31-FITC (megakaryocytes and endothelial cells), and Phalloidin-CF633 (actin) to visualize their location and proximity to blood vessels in the bone marrow. Low and high magnifications are shown.
We next analyzed the ploidy status of bone marrow and spleen megakaryocytes by flow cytometry, using CD41 and CD42b to phenotypically identify respectively megakaryocytes and megakaryocytes enriched at a more advanced differentiation stage, but no significant differences were observed between dKO and WTlox mice (Figure 2C-D and supplemental Figure 2).
dKO megakaryocytes display aberrant DMS and proplatelet formation
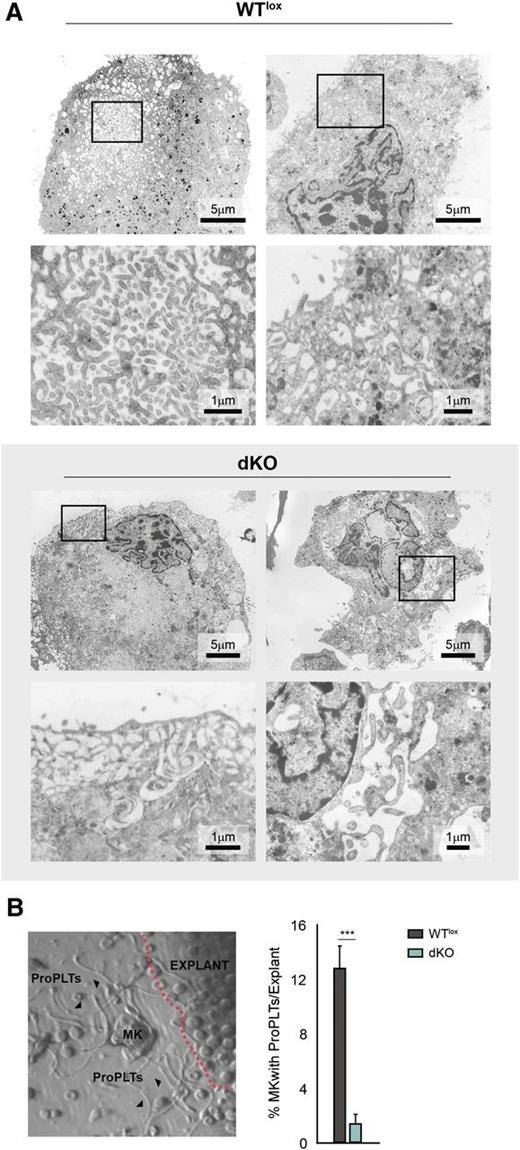
We next used electron microscopy to study the DMS of cultured bone marrow–derived megakaryocytes, harvested at day 7. Whereas in WTlox cultures most of the megakaryocytes showed an intricate, compact, and well-developed DMS, dKO megakaryocytes were highly heterogeneous regarding DMS morphology. Some of the dKO megakaryocytes displayed an apparently normal DMS, but the majority contained a very loose DMS or large vacuolar spaces in their cytoplasm (Figure 3A and supplemental Figure 3). Such a defect likely leads to impaired proplatelet formation and will therefore affect platelet production.
dKO megakaryocytes display an aberrant DMS and are incapacitated to form proplatelets. (A) Electron microscope images of bone marrow–derived cultured megakaryocytes. Representative pictures are shown. WTlox megakaryocytes display a normal compact DMS, whereas dKO megakaryocytes present with an abnormal less compact DMS or even larger vacuolar cytoplasmic structures. See supplemental Figure 3 for additional pictures. (B) Micrograph of the periphery of a bone marrow explant (left) (contour indicated by dashed line). A megakaryocyte (MK) in the center of the image has formed proplatelets (ProPLTs, arrowheads). Such MKs with ProPLTs are counted as one unit, and the percentage of units with proplatelets of total counted megakaryocytes is depicted (bar graph on the right). See supplemental Videos 1-3 showing WT megakaryocytes forming proplatelets and supplemental Figure 4 for explant still images.
dKO megakaryocytes display an aberrant DMS and are incapacitated to form proplatelets. (A) Electron microscope images of bone marrow–derived cultured megakaryocytes. Representative pictures are shown. WTlox megakaryocytes display a normal compact DMS, whereas dKO megakaryocytes present with an abnormal less compact DMS or even larger vacuolar cytoplasmic structures. See supplemental Figure 3 for additional pictures. (B) Micrograph of the periphery of a bone marrow explant (left) (contour indicated by dashed line). A megakaryocyte (MK) in the center of the image has formed proplatelets (ProPLTs, arrowheads). Such MKs with ProPLTs are counted as one unit, and the percentage of units with proplatelets of total counted megakaryocytes is depicted (bar graph on the right). See supplemental Videos 1-3 showing WT megakaryocytes forming proplatelets and supplemental Figure 4 for explant still images.
To investigate the capacity of megakaryocytes to form proplatelets, an ex vivo bone marrow explant method was used.36 In dKO explants, the same number of megakaryocytes appeared in the periphery after 6 hours when compared with WTlox explants, but proplatelet production was severely impaired (Figure 3B, supplemental Figure 4, and supplemental Videos 1-3). Collectively, the aberrant DMS and severely reduced ability to form proplatelets offer an explanation for the macrothrombocytopenia observed in dKO mice.
dKO mice display impaired platelet function
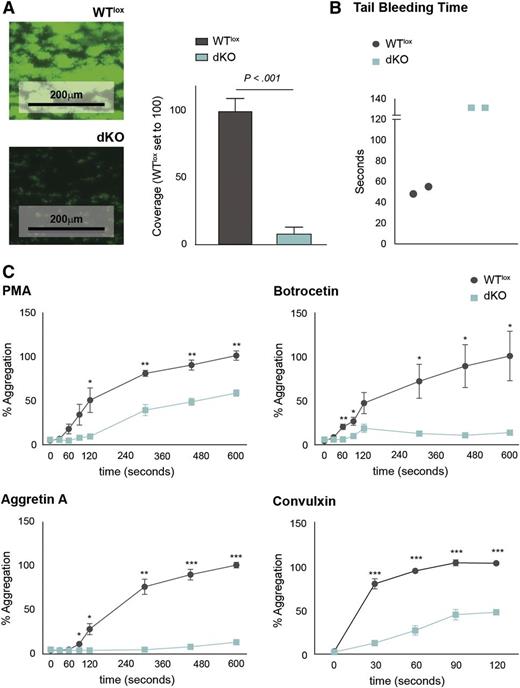
Since thrombocytopenias are often accompanied by platelet dysfunction,14 we decided to study platelet function in dKO mice. Platelets recognize different substrates at damaged vessel walls including collagen and von Willebrand factor (vWF), which are recognized by α2β1 integrin/GPVI and vWF receptor, respectively, leading to platelet activation and thrombus formation, which is ultimately dependent on fibrinogen binding via αIIbβ3 integrin.34,40 We evaluated the capacity of dKO platelets to form thrombi in vitro by perfusing reconstituted blood containing an equal number of platelets over a collagen-coated surface at physiological flow rates. dKO platelets had a profoundly reduced capacity to form thrombi when compared with WTlox platelets, as measured by coverage of platelet thrombi (Figure 4A). Similarly, the tail bleeding time was increased in dKO when compared with WTlox mice (Figure 4B).
Platelets from dKO mice are dysfunctional. (A) Micrographs of collagen-coated slides after perfusion of WTlox and dKO reconstituted blood containing the same number of platelets (left). The average coverage measured as green fluorescence over the total surface was quantitated with ImageJ software. (B) Tail bleeding time of WTlox and dKO mice is depicted. (C) FCA shows the aggregation capacity of platelets when stimulated with different agonists. *P < .05; **P < .01; ***P < .001.
Platelets from dKO mice are dysfunctional. (A) Micrographs of collagen-coated slides after perfusion of WTlox and dKO reconstituted blood containing the same number of platelets (left). The average coverage measured as green fluorescence over the total surface was quantitated with ImageJ software. (B) Tail bleeding time of WTlox and dKO mice is depicted. (C) FCA shows the aggregation capacity of platelets when stimulated with different agonists. *P < .05; **P < .01; ***P < .001.
Next, we used FCA to study the contribution of specific platelet receptors to platelet aggregation.34 Isolated platelets were stimulated with the agonists phorbol 12-myristate 13-acetate (PMA) (which activates the fibrinogen receptor αIIbβ3 integrin), botrocetin (which activates the vWF receptor), aggretin A (which activates the Clec2 receptor), and convulxin (which activates GPVI).34,40 We observed that the aggregation capacity of dKO platelets was decreased compared with WTlox platelets. However, whereas PMA and convulxin caused a decrease in maximum activation but comparable aggregation kinetics in dKO when compared with WTlox platelets, the responses to aggretin A and botrocetin were almost completely abrogated (Figure 4C).
Analysis of the megakaryocyte transcriptome and platelet proteome in dKO mice
To identify Sp1/Sp3 potential target genes affected in dKO mice and relevant for megakaryopoiesis, bone marrow–derived megakaryocytes were isolated from dKO and WTlox cultures and their transcriptomes were analyzed by RNA sequencing (RNA-seq) (Figure 5, supplemental Figure 5, and supplemental Table 1). In parallel, the protein content of freshly isolated dKO and WTlox platelets was analyzed by mass spectrometry (Figure 6, supplemental Figure 6, and supplemental Tables 2 and 3).
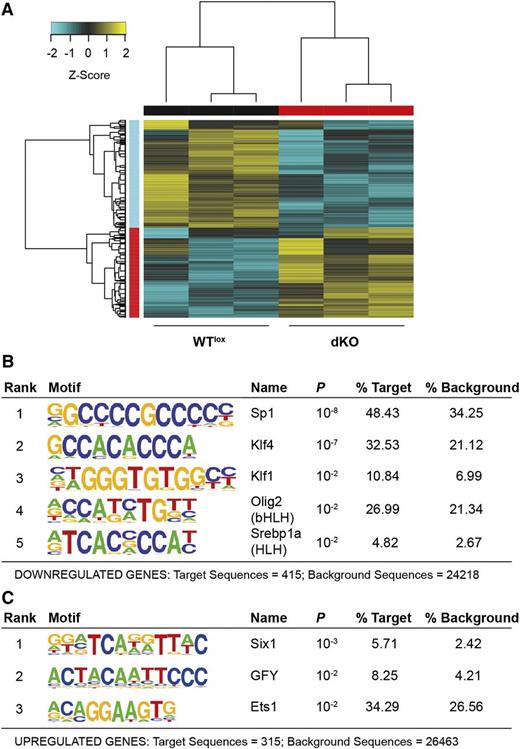
Megakaryocyte RNA-seq. (A) Hierarchical clustered heat map with scaled Z-score color key of normalized counts of 833 differentially expressed genes in 3 WTlox and 3 dKO samples. Samples with the same genotype are indicated by black (WTlox) and red (dKO) horizontal bars; gene clusters are indicated by red (upregulated in dKO) and cyan (downregulated in dKO) vertical bars. (B) Transcription factor binding sites enrichment detected, using HOMER, in promoters of 454 downregulated genes in dKO with a threshold FDR <0.01. (C) Transcription factor binding sites enrichment detected, using HOMER, in promoters of 379 upregulated genes in dKO with a threshold FDR <0.01.
Megakaryocyte RNA-seq. (A) Hierarchical clustered heat map with scaled Z-score color key of normalized counts of 833 differentially expressed genes in 3 WTlox and 3 dKO samples. Samples with the same genotype are indicated by black (WTlox) and red (dKO) horizontal bars; gene clusters are indicated by red (upregulated in dKO) and cyan (downregulated in dKO) vertical bars. (B) Transcription factor binding sites enrichment detected, using HOMER, in promoters of 454 downregulated genes in dKO with a threshold FDR <0.01. (C) Transcription factor binding sites enrichment detected, using HOMER, in promoters of 379 upregulated genes in dKO with a threshold FDR <0.01.
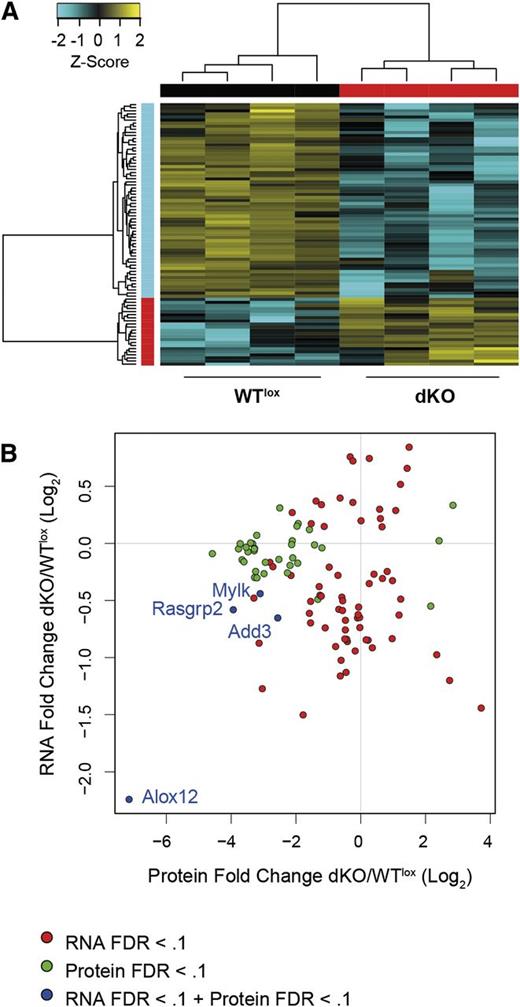
Platelet proteomics with integrative RNA-seq analysis. (A) Hierarchical clustered heat map with scaled Z-score color key of log2 transformed label-free quantification (LFQ) intensities of 85 differentially expressed proteins in 4 WTlox and 4 dKO platelet lysate samples. Samples with the same genotype are indicated by black (WTlox) and red (dKO) horizontal bars and protein expression clusters are indicated by red (upregulated in dKO) and cyan (downregulated in dKO) vertical bar. (B) Scatterplot of differentially expressed proteins in platelets (mass spectrometry) and differentially expressed genes in megakaryocytes (RNA-seq) in dKO samples with n = 106. MS, mass spectrometry.
Platelet proteomics with integrative RNA-seq analysis. (A) Hierarchical clustered heat map with scaled Z-score color key of log2 transformed label-free quantification (LFQ) intensities of 85 differentially expressed proteins in 4 WTlox and 4 dKO platelet lysate samples. Samples with the same genotype are indicated by black (WTlox) and red (dKO) horizontal bars and protein expression clusters are indicated by red (upregulated in dKO) and cyan (downregulated in dKO) vertical bar. (B) Scatterplot of differentially expressed proteins in platelets (mass spectrometry) and differentially expressed genes in megakaryocytes (RNA-seq) in dKO samples with n = 106. MS, mass spectrometry.
RNA-seq analysis revealed 833 differentially expressed genes in dKO megakaryocytes (false discovery rate [FDR] <0.01; Figure 5A, supplemental Figure 5, and supplemental Table 1). Gene ontology term enrichment analysis revealed a number of pathways specifically affected, such as microtubule polymerization, necrosis, metabolism, transcription, granule transport, and hemostasis (supplemental Figure 5). Transcription factor binding motif (Homer) analysis on the promoters of the dKO deregulated genes identified the Sp binding site motif with the lowest P value (P = 10−8) in dKO downregulated genes, suggesting that they might be direct Sp1/Sp3 targets (Figure 5B). This was not the case when examining the enriched binding motifs of dKO upregulated genes, ie, Six1, GFY or Ets1 transcription factors, that were enriched with a much higher P value (P = 10−3) (Figure 5C). This suggests that globally, Sp1 and Sp3 are activators of transcription in megakaryocytes.
To complement the RNA-seq data, we examined the proteome of platelets. We identified 85 proteins differentially expressed in dKO platelets, of which 63 where downregulated (FDR <0.25; Figure 6A, supplemental Figure 6, and supplemental Tables 2 and 3). The functions of the differentially expressed proteins were linked to cell metabolism, cytoskeleton rearrangement, receptor signaling, and protein folding. As indicated in supplemental Figure 6 and supplemental Table 3, 40% of these proteins have been reported previously as potential Sp1/Sp3 target genes or their gene promoters contain G-rich SP binding sites. Furthermore, a number of these proteins have been previously identified as essential during megakaryopoiesis and for platelet function, ie, Myh9, Flna, Rasgrp2, Fermt3, Src, and Syk.7,12,41-45 Deregulation of these proteins could readily explain the defective megakaryocyte DMS and proplatelet formation and the platelet dysfunction observed in dKO mice.
We next compared the RNA-seq and proteomics data sets to identify the transcripts/proteins with identical signatures (supplemental Figure 6C and Figure 6B). As shown in Figure 6B, only 4 hits shared the same overlapping signature with an FDR <0.1 in both data sets, ie, Add3 (adducin γ, involved in assembly of the spectrin-actin network), Alox12 (arachidonate 12-lipoxygenase, involved in the production and metabolism of fatty acid hydroperoxides), Mylk (myosin light-chain kinase), and Rasgrp2 (RAS guanyl-releasing protein 2 calcium and DAG regulated, which functions in platelet aggregation through integrin inside-out signaling). Among these 4 proteins, Alox12 appears to fully require Sp1/Sp3 transcription factors, because it was among the top 20 downregulated genes in dKO megakaryocytes and we could not detect any peptides in dKO platelets (supplemental Tables 1-3). We validated downregulation of these factors in dKO megakaryocytes (messenger RNA, by quantitative reverse-transcription polymerase chain reaction) and in platelets (protein, by western blotting) (supplemental Figure 6D).
Selective Mylk inhibition by ML7 affects proplatelet formation and stabilization and interferes with ITAM receptor–induced platelet aggregation
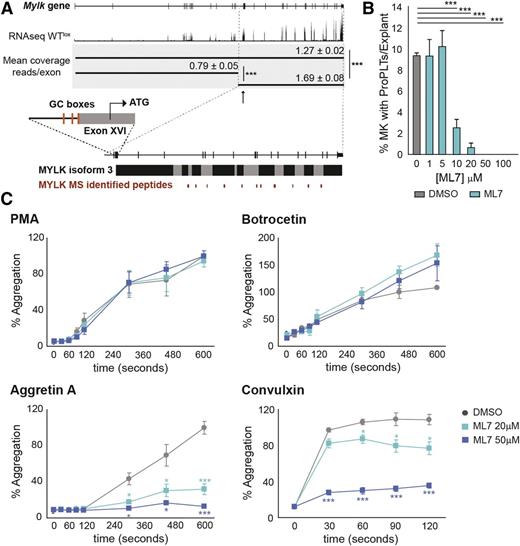
Myosin light-chain kinase (Mylk) was one of the targets with highest score on signature overlap and significantly downregulated in megakaryocytes (messenger RNA) and platelets (protein). We could map the peptide coverage to the previously reported Mylk isoform 3,46 which is translated from an alternative start codon present on exon 16, corroborating previous data reporting that this is the major Mylk isoform present in platelets.47-49 The RNA-seq data also confirms that megakaryocytes mainly express this isoform (Figure 7A). The promoter governing the transcription of this isoform contains G-rich elements (Sp binding sites; Figure 7A). Mylk phosphorylates myosin regulatory light chains to facilitate myosin interaction with actin filaments to produce contractile activity, and as such it represents a potential essential factor during proplatelet formation and platelet activation. It is known that myosin light-chain phosphorylation has a modulatory role on platelet activation.50 Interestingly, it has been recently reported from studies in zebrafish morphants that Mylk1a (a thrombocyte-enriched Mylk ortholog) is required for thrombus formation,51 but its function during megakaryopoiesis in mammals has not been studied in detail.
Selective Mylk inhibition by ML7 affects proplatelet formation and stabilization and interferes with platelet Clec-2 and GPVI downstream signaling. (A) Graphic representation of Mylk gene, Mylk isoform 3, and the peptide coverage identified in dKO platelets corresponding to Mylk isoform 3. Sp GC-rich binding sites are depicted on the promoter region upstream the Mylk isoform 3 ATG starting codon. (B) Explant assay performed with WT mice after addition of Mylk inhibitor ML7 at different concentrations or DMSO. The percentage of megakaryocytes with proplatelets of total counted megakaryocytes per explant is depicted. See supplemental Videos 4-7 showing that ML7 inhibition of Mylk after proplatelet formation results in proplatelet retraction. (C) FCA of WT platelets preincubated with either DMSO or ML7. *P < .05; ***P < .001.
Selective Mylk inhibition by ML7 affects proplatelet formation and stabilization and interferes with platelet Clec-2 and GPVI downstream signaling. (A) Graphic representation of Mylk gene, Mylk isoform 3, and the peptide coverage identified in dKO platelets corresponding to Mylk isoform 3. Sp GC-rich binding sites are depicted on the promoter region upstream the Mylk isoform 3 ATG starting codon. (B) Explant assay performed with WT mice after addition of Mylk inhibitor ML7 at different concentrations or DMSO. The percentage of megakaryocytes with proplatelets of total counted megakaryocytes per explant is depicted. See supplemental Videos 4-7 showing that ML7 inhibition of Mylk after proplatelet formation results in proplatelet retraction. (C) FCA of WT platelets preincubated with either DMSO or ML7. *P < .05; ***P < .001.
We performed bone marrow explant cultures in the presence of the selective Mylk inhibitor ML752 at different concentrations, and we examined proplatelet formation after 6 hours. Addition of 20 μM ML7 resulted in almost complete inhibition of proplatelet formation (Figure 7B). Surprisingly, when we added ML7 once proplatelets had been formed, we observed complete retraction of the proplatelets, as opposed to dimethylsulfoxide (DMSO) controls (supplemental Videos 4-7). These results suggest that Mylk is required not only for proplatelet formation but also for proplatelet stabilization. Because Mylk requires and is activated by Ca2+/calmodulin,48 we next applied EDTA to megakaryocytes in our explants once proplatelets had been formed in order to interfere with Ca2+ signaling. Interestingly, we observed complete proplatelet retraction due to extracellular Ca2+ sequestration (supplemental Video 8). This suggests that Ca2+ signaling is required and can modulate proplatelet stabilization, using Mylk as one of its downstream effector kinases.
We next applied ML7 to wild-type (WT) platelets that were induced to aggregate in the presence of PMA, botrocetin, aggretin A, or convulxin. We observed a marked inhibition of aggregation induced by aggretin A and convulxin in the presence of ML7, but not to aggregation induced by the other agonists used (Figure 7C), suggesting that Mylk is necessary downstream the platelet ITAM receptors Clec-2 and GPVI, which are known to invite Ca2+/calmodulin via PLCγ to execute its complete signaling.53
In summary, we conclude that the ubiquitous Sp1/Sp3 transcription factors are required for proper platelet production and function. Depletion of Sp1/Sp3 in the megakaryocytic lineage results in deregulation of a number of proteins with well-known functions in megakaryopoiesis, such as Myh9, Rasgrp2, Syk, and Flna, resulting in megakaryocyte terminal maturation defects, macrothrombocytopenia, and platelet malfunction. Furthermore, Alox12 transcription absolutely requires Sp1/Sp3 transcription factors, and we identified Mylk as a potential Sp1/Sp3 target. We show that Mylk inhibition by ML7 affects proplatelet formation and stabilization and interferes with platelet ITAM receptor–dependent signaling functions.
Discussion
This study shows the intrinsic effect of loss of transcription factors Sp1 and Sp3 during megakaryopoiesis and on platelet function in adult mice. Upon ablation of Sp1 and Sp3 in megakaryocytes, DMS development and proplatelet formation are defective, leading to severe macrothrombocytopenia and platelet dysfunction in dKO mice.
Transcriptomics analysis on dKO megakaryocytes revealed ∼800 differentially expressed genes. G-rich Sp binding motifs were enriched only in the promoters of downregulated genes, suggesting that globally, Sp1/Sp3 are activators of transcription in megakaryocytes. G-rich Sp binding motifs were not enriched in the subset of upregulated genes, suggesting that their promoters might be regulated, for example, by other transcription factors affected by loss of Sp1/Sp3. Notably, Sp7 is increased significantly (log2 fold change = 1.2803; FDR <0.01), which could provide some compensatory regulatory functions. Among the differentially expressed genes, many are involved in cell metabolism. However, a large proportion of affected genes/proteins are known to play an essential role during megakaryopoiesis or in platelet function.
Treatment of patients with mithramycin, an antineoplastic antibiotic that binds to GC-rich regions in the DNA and interferes with Sp transcription factor activity, results in thrombocytopenia and bleeding.54,55 Furthermore, from our proteomics analysis, we identified 2 α-granule proteins significantly downregulated in dKO platelets, ie, Pros1 (S protein) and F13a1. In humans, mutations in the regulatory region of these genes specifically affecting a GC-rich Sp DNA binding motif result in deficiency of PROS1 and F13A1, respectively.56,57 ALOX12, a RUNX1 target gene,58 is severely reduced in dKO megakaryocytes and platelets. ALOX12 and F13A1 are both downregulated in patients bearing CBFA2/RUNX1 mutations and presenting macrothrombocytopenia.59 In addition, these patients show deficiencies in the activity of PKCθ, PLCβ2, and MYLK.60 It is possible that in our dKO mice, specific transcription factor complexes, which are finely orchestrated during normal megakaryopoiesis (ie, Runx1/Sp1/Sp3), are disturbed.
A number of proteins essential for megakaryopoiesis and/or platelet function are significantly downregulated in dKO platelets. For example, Myh9, Flna, Calpn2, Fermt3, Rasgrp2, Syk, Src,7,8,12,41,44,61 and proteins involved in cytoskeletal rearrangements or in the folding of cytoskeletal proteins. Some of them have been previously reported to be directly regulated by Sp1, such as Flna,62 or contain G-rich motifs on their promoters. MYH9 patients have a defect not only in megakaryocyte DMS and proplatelet formation but also in migration.8 We do not observe a defect in migration of dKO megakaryocytes based on their distribution in bone marrow cryosections, indicating that the remaining level of Myh9 is sufficient to support this process. Megakaryocyte-specific Flna knockout mice are severely macrothrombocytopenic and platelets have altered signaling through αIIbβ3 integrin, GPVI, and Clec-2 receptors.42,43 These characteristics correlate with those observed in our dKO mice, indicating that reduced Flna expression contributes to the defects observed in dKO platelets. It has been reported that Flna-deficient platelets have a decreased expression of GP1ba.63 Although in our proteomics data we observed downregulation of GP1ba, it did not reach significance (log2 fold change = −0.4; FDR = 0.7). Of note, platelets of dKO mice have lowered levels of Flna, but not complete absence of the protein. Furthermore, the simultaneous downregulation of Flna, Lyn, Src, and Syk explains the platelet aggregation defect upon stimulation with botrocetin, ie, defective vWF receptor function.64,65
Our data suggest that Mylk is necessary for proplatelet formation and stabilization in megakaryocytes and that Mylk is required for Clec-2 and GPVI downstream signaling. In human platelets, it is known that Mylk inhibition with a blocking agent leads to decreased shape change upon stimulation with convulxin,66 which activates GPVI, and that ML7 inhibition interferes with convulxin- and collagen-induced aggregation,67 corroborating our results.
Mylk is an effector kinase highly dependent on Ca2+/calmodulin signaling.48 Recently, it has been characterized how the store-operated Ca2+ entry functions in megakaryocytes,68 highlighting the different spatiotemporal levels and effects of intracellular and extracellular Ca2+ signaling during megakaryopoiesis.68,69 When we applied EDTA to sequester extracellular Ca2+ once proplatelets had formed in bone marrow explants, we observed similarly proplatelet retraction as when we applied ML7 Mylk inhibitor, supporting the notion that Ca2+ signaling regulates the process of proplatelet formation. Of note, sequestration of the intracellular Ca2+ pool with BAPTA does not affect proplatelet formation,70 which makes store-operated Ca2+ entry mechanism and extracellular Ca2+ more relevant. Our findings seem to contradict previous studies in which another Mylk inhibitor enhances proplatelet formation.71 However, not only is the inhibitor used different, but also it is performed on human CD34+ in vitro–derived megakaryocytes, whereas we analyzed the effects of Mylk inhibition on in vivo–matured murine megakaryocytes, within the native bone marrow tissue. It is not clear whether both inhibitors target the complete array of Mylk functions, and it has been suggested that Mylk phosphorylates substrates other than myosin light chain.72,73 In accordance with our findings, manipulation of upstream/activating components of the Ca2+/calmodulin pathway have been previously linked to deficits in proplatelet formation in mouse models, ie, PKC and PLC.69,70,74 It is important to acknowledge that microtubule dynamics might be fine-tuned in a more complex way, and alterations on this process result in the same readout, ie, proplatelet retraction. For example, inhibition of serine/threonine phosphatases 1/2A by calyculin A also results in proplatelet retraction.75 Proplatelet production and progression require not only the growth of microtubules at the plus ends but also the sliding of microtubules.76,77 Microtubule sliding is Ca2+ dependent, requires actomyosin complex formation, is restricted to available dynein, and is blocked when inhibiting Mylk with ML7.78 Proplatelet retraction has been observed previously in vitro in the presence of microtubule-destabilizing agents,77 but the notion that Mylk might be required for the formation and stabilization of proplatelets suggests not only that microtubule sliding is essential to the process but also that proplatelet formation is potentially reversible in vivo, depending on Ca2+ signaling cues.
It is remarkable that the ubiquitously expressed Sp1/Sp3 transcription factors control such specific processes in the highly specialized megakaryocytes, whereas we did not observe the expected defects in generic housekeeping functions thought to be regulated by Sp1/Sp3. Further studies will aim at the individual contribution of the differentially expressed genes and the Sp1/Sp3–transcription factor interaction network during megakaryopoiesis. Such knowledge may contribute to the identification of causative mutations in the increasing group of macrothrombocytopenias of unknown etiology.15
The online version of this article contains a data supplement.
The publication costs of this article were defrayed in part by page charge payment. Therefore, and solely to indicate this fact, this article is hereby marked “advertisement” in accordance with 18 USC section 1734.
Acknowledgments
The authors thank Prof J. Eble for kindly providing aggretin A.
This study was funded by the Center for Translational Molecular Medicine (http://www.ctmm.nl), project Innovative Coagulation Diagnostics (INCOAG, grant 01C-201), and the Dutch Heart Foundation. H.J.G.v.d.W. was supported by the Netherlands Genomics Initiative (NGI Zenith 93511036); D.I.K. and S.P. received support from the Landsteiner Foundation for Blood Transfusion Research (LSBR 1040), the Netherlands Organization for Scientific Research (NWO/ZonMw TOP 40-00812-98-08032, 40-00812-98-12128 and DN 82-301), and EU fp7 Specific Cooperation Research Project THALAMOSS (306201); and J.A.A.D. and E.-J.R. were supported by the Netherlands Proteomics Center.
Authorship
Contribution: M.M., D.I.K., and L.G. designed and performed experiments, analyzed data, and wrote the paper; S.P. designed experiments, analyzed data, and wrote the paper; H.J.G.v.d.W. and W.F.J.v.I. analyzed data and wrote the paper; T.K.v.d.B. reviewed the paper and participated in discussions; M.H. and H.J. performed experiments; R.W.W.B., E.-J.R., and J.A.A.D. analyzed data; and I.K. and G.S. designed and generated the Sp3 lox mouse line.
Conflict-of-interest disclosure: The authors declare no competing financial interests.
Correspondence: Laura Gutiérrez, Sanquin Research, Department of Blood Cell Research, room Y411, Plesmanlaan 125, Amsterdam 1066CX, The Netherlands; e-mail: l.gutierrez@sanquin.nl; and Sjaak Philipsen, Erasmus MC, Department of Cell Biology, room Ee1000, Wytemaweg 80, Rotterdam 3015CN, The Netherlands; e-mail: j.philipsen@erasmusmc.nl.
References
Author notes
M.M. and D.I.K. contributed equally to this study.
L.G. and S.P. contributed equally to this study.

This feature is available to Subscribers Only
Sign In or Create an Account Close Modal