Abstract
Introduction: The addition of rituximab to the CHOP backbone has improved the outcome of patients with diffuse large B-cell lymphoma (DLBCL). However, over 30% of patients still have a high risk of treatment failure or relapses and cannot be selected accurately by the classic prognostic factors. Molecular profiling has individualized categories with different outcomes. Baseline total metabolic tumor volume seems also to be an important tool to predict outcome in DLBCL, as demonstrated by Casasnovas (Casasnovas et al Hematol Oncol 2015:33,suppl 1) but has not been associated with molecular data. Our study investigated the prognostic impact of baseline PET metrics, including total metabolic tumor volume (TMTV0) and their added value to molecular characteristics (ABC/GCB status, MYC overexpression).
Methods: From 2003 to 2009, 81 patients with newly diagnosed DLBCL were retrospectively included. They were treated with rituximab associated with CHOP or ACVBP regimen. All had a baseline FDG-PET/CT. TMTV0 was computed by summing the metabolic volumes of all nodal and extranodal lesions obtained using the 41% SUVmax thresholding method. According to the gene expression profile (GEP), determined using DASL (cDNA-mediated Annealing, Selection, Ligation and extension), a subset of 57 patients was classified in GCB or ABC subtypes. An exploratory analysis was done on MYC expression. Optimal cut points for binary outcome were determined by X-tile" and ROC analysis.
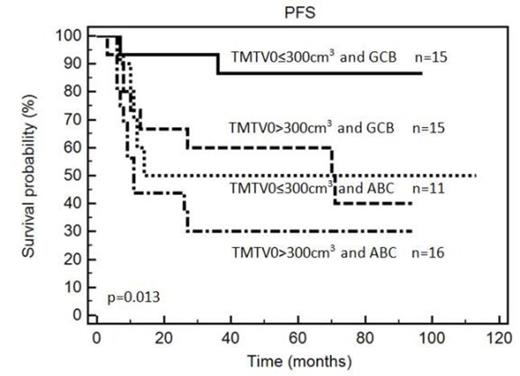
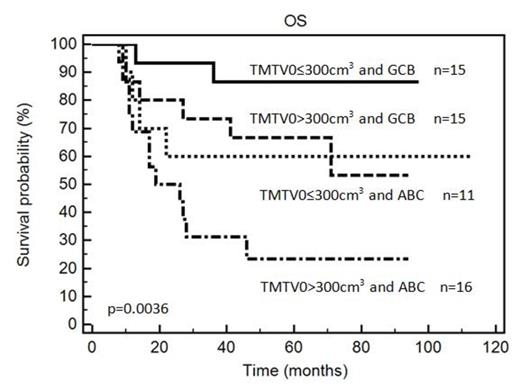
Results: 81 patients with a median age of 66 years were enrolled: 80% were stage III/IV, 73% had elevated LDH, 67% IPIaa>1. Median pre-therapy TMTV0 was 320 cm3 (25th-75th percentiles 106-668 cm3). With a median follow-up of 64 months, the 5y-PFS was 60% and the 5y-OS was 63% in the whole population. Using a cut off of 300 cm3, patients with a high TMTV0 (n=43, 53%) had a significantly shorter PFS and OS than those with a low TMTV0 (5y-PFS: 76% vs. 43%, p=0.0023, HR=3.0 and 5y-OS: 78% vs. 46%, p=0.0047, HR=3.0). Patients with a high TMTV0 had a more aggressive disease, with significantly more advanced stage (100%) and higher frequency of IPIaa>1 (93%) than patients with a low TMTV0 (p<0.0001 and p<0.0001 respectively). As expected, ABC status (n=27) was associated with a worse outcome (5y-PFS: 38% vs. 70%, p=0.019, HR=2.4; 5y-OS:37% vs 73%, p=0.0046, HR=3.1). In multivariate analysis, TMTV0 and cells of origin were independent prognostic factors for PFS (p=0.028 and p=0.038 respectively) and OS (p=0.035 and p=0.013). Combining these two factors, TMTV0 allowed a better sub-stratification of ABC/GCB patients (p=0.013 for PFS and p=0.0036 for OS). GCB patients with small TMTV0(n=15) had a 87% 5y-PFS and 86% 5y-OS compared to 53% and 60% for GCB with high TMTV0 (n=15); ABC patients with small TMTV0 (n=11) 50% and 60% compared to 30% and 23% for ABC with high TMTV (n=16) (figure 1). Patients with overexpression of MYC (n=26) had an increased risk of relapse or progression (p=0.0032, HR=3.08) and a reduced survival rates (p=0.0004, HR=4.25). Combining MYC with TMTV0 gave an added prognostic value by splitting the population in 3 risk groups: MYC negative and low TMTV0 (n=16, 5y-PFS of 93% and 5y-OS 93%) ; MYC negative and high TMTV0 (n=15, 45% and 55%) ; MYC positive whatever TMTV0 (n=26, 30% and 30%), p=0.0011 and p=0.0005 respectively.
Conclusion: The addition of TMTV0 improved the risk stratification of ABC/GCB subtypes and MYC expression. The combination of molecular and imaging characteristicts at diagnosis could lead to a more accurate selection of patients, in order to increase tailor therapy.
Kaplan Meier estimates of progression-free (PFS) and overall survival (OS) according to the baseline total metabolic tumor volume (TMTV0) combining with ABC/GCB
Kaplan Meier estimates of progression-free (PFS) and overall survival (OS) according to the baseline total metabolic tumor volume (TMTV0) combining with ABC/GCB
No relevant conflicts of interest to declare.
Author notes
Asterisk with author names denotes non-ASH members.


This feature is available to Subscribers Only
Sign In or Create an Account Close Modal