Abstract
Introduction
Treatment of PCNSL has focused on multi-agent chemotherapy designed to cross the blood brain barrier (BBB); radiation therapy (RT) has a high response rate, but responses tend to be transient and associated with cognitive toxicity. The addition of rituximab has improved treatment outcomes for virtually all CD20-positive B-cell malignancies. Although rituximab is not believed to cross the BBB, enhancement on MRI corresponds with areas of BBB breakdown that could allow penetration of the antibody. Here we report the results of E1F05, an ECOG-ACRIN multicenter phase 2 prospective trial of rituximab added to a high-dose methotrexate (HD-MTX)-based chemotherapy regimen very similar to that used in the RTOG 93-10 study, but without RT.
Methods
Immunocompetent patients with newly diagnosed PCNSL, ECOG PS ≤3, with adequate liver and kidney function were eligible. Subjects received HD-MTX 3.5g/m2 with vincristine 1.4mg/m2 IV (flat cap of 2.8mg) weeks 1, 3, 5, 7, and 9, with leucovorin rescue; procarbazine 100mg/m2 PO daily for 7 days in weeks 1, 5, and 9; cytarabine 3g/m2 /day IV over 2 hours for 2 days on weeks 11 and 14; dexamethasone 16mg/day week 1, tapered by 4mg/week for weeks 2 and 3, 2mg/week weeks 4-6; and rituximab 375mg/m2 IV infusion 3 times a per week for weeks 1-4. Subjects with CSF involvement received intrathecal MTX 12mg every two weeks on weeks 2, 4, 6, 8, and 10 with leucovorin rescue.
The primary endpoint was complete response rate (CR). Predefined secondary endpoints were PFS, OS. A total of 39 subjects was required to be able to rule out a 50% CR rate, with 90% power to detect a 70% CR rate. An interim analysis was planned after accrual of 23 subjects, requiring >12 CR to proceed to full accrual.
Results
Twenty-six patients were enrolled from December 2006 to February 2010; one subject was ineligible but included in toxicity evaluation. Median age was 57 (range 30-76); 40% were male (table 1). Sixteen subjects (65%) completed treatment per protocol; the most common reason for discontinuation was adverse events (4 subjects); 2 discontinued due to progressive disease (PD). Central radiology review (per the International PCNSL Collaborative Group) revealed that CR + CRu was 16/25 (64%,.95CI(42.5%-82%); ORR= 20/25 (80%), and 4/25(16%) had PD. Although the primary endpoint was met, the study was not re-opened after the interim analysis due to slow accrual and competing trials.
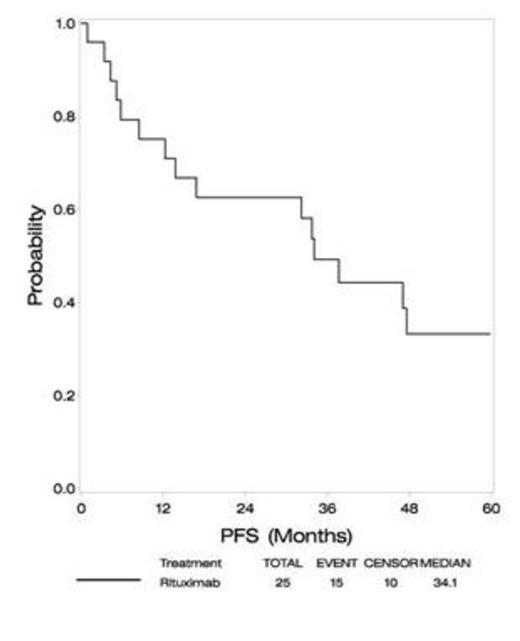
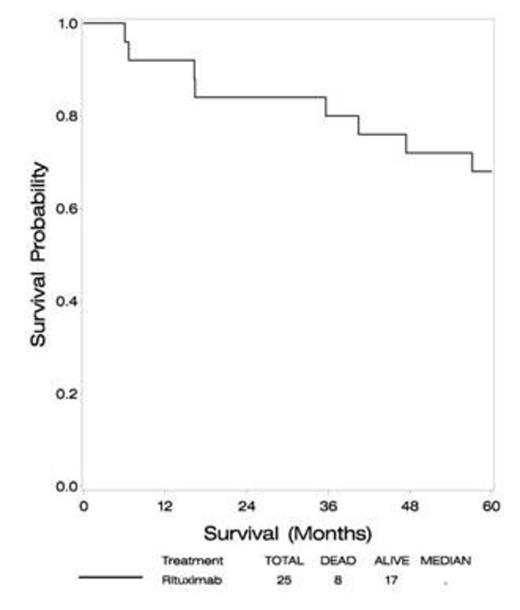
At a median follow-up of 60 months, median PFS is 34 months (compared to 24 months in RTOG93-10), and median OS has not been reached (versus 37 months in RTOG93-10). Four year PFS is 33%, with 4 year OS 72% (approximately 30% in RTOG 93-10).
No treatment-related deaths occurred. The most common grade 3-4 toxicities were hematologic (23% anemia, 77% neutropenia, 19% thrombocytopenia).
Conclusion
The addition of rituximab to multiagent chemotherapy is well tolerated. Response rates, PFS and OS are comparable to or better than those seen in RTOG 93-10, which included RT. These promising results suggest rituximab has activity in the CNS and may improve outcomes in PCNSL.
Subject Demographics
| Characteristics . | . | N . | (%) . |
|---|---|---|---|
| Gender | Male | 10 | (40) |
| Female | 15 | (60) | |
| Age | Minimum | 30 | - |
| 25% | 51 | - | |
| Median | 57 | - | |
| 75% | 68 | - | |
| Maximum | 76 | - | |
| ECOG PS | 0-1 | 16 | (64) |
| 2-3 | 9 | (36) | |
| Neurologic Function Status | No Symptoms | - | - |
| Minor Symptoms | 11 | (44) | |
| Moderate Symptoms/Fully Active | 5 | (20) | |
| Moderate Symptoms/Less than Fully Active | 7 | (28) | |
| Severe Neurologic Symptoms | 2 | (8) |
Best overall response
| Response . | N . | (%) . |
|---|---|---|
| CR | 7 | (28) |
| CRU* | 9 | (36) |
| PR | 4 | (16) |
| Stable | -- | -- |
| PD | 4 | (16) |
| Unevaluable | 1 | (4) |
| Response . | N . | (%) . |
|---|---|---|
| CR | 7 | (28) |
| CRU* | 9 | (36) |
| PR | 4 | (16) |
| Stable | -- | -- |
| PD | 4 | (16) |
| Unevaluable | 1 | (4) |
*CR unconfirmed
Outcome
| Median Follow-Up . | 60 months . |
|---|---|
| PFS | |
| Median | 34 months |
| 2 year | 63% |
| 3 year | 49% |
| 4 year | 33% |
| OS | |
| Median | ---- |
| 2 year | 84% |
| 3 year | 80% |
| 4 year | 72% |
| Median Follow-Up . | 60 months . |
|---|---|
| PFS | |
| Median | 34 months |
| 2 year | 63% |
| 3 year | 49% |
| 4 year | 33% |
| OS | |
| Median | ---- |
| 2 year | 84% |
| 3 year | 80% |
| 4 year | 72% |
Advani:Seattle Genetics, Inc.: Research Funding; Genetech: Consultancy.
Author notes
Asterisk with author names denotes non-ASH members.


This feature is available to Subscribers Only
Sign In or Create an Account Close Modal