Abstract
Background. Recent advances in MM therapy create a need for multi-modality response assessments, in order to optimise patient outcomes. Radiological tools can assess the entire skeleton, with the potential to depict heterogeneity of response and help target biopsy of resistant lesions. MRI-based assessment of focal lesions (FL) has been incorporated into the definition of symptomatic MM, providing the rationale for exploring MRI-based response assessment biomarkers. Diffusion weighted imaging derived apparent diffusion coefficient (ADC) has been studied, but standardisation of ADC values across MRI scanners is challenging, limiting generalisability. Fat fraction (FF), also evaluable by MRI, may be a more reliable parameter that could be expected to increase following response to therapy.
Methods. This study aimed to evaluate changes in FF in FLs of newly diagnosed MM patients by whole body MRI (WB-MRI) prior to treatment (Pre) and after 8 weeks (8W). WB-MRI was performed on a 3.0 T scanner. Whole-body T2 weighted imaging and axial DWI MRI were supplemented by pre- and post-contrast coronal 2-point mDixon imaging for evaluation of FF. mDixon images were reconstructed as fat only and water only studies. For each patient, up to 20 FLs were localised for analysis by 2 radiologists in consensus, who prospectively scored (score 1-5, 1=highly unlikely, 5=highly likely) involvement of each of 10 anatomical regions. FLs > 5mm with score 4 or 5 were selected for quantitative analysis. A matched region of interest (ROI) was contoured for each FL on water only and fat only mDixon images as well as DWI images. FF was derived from ROI signal intensity (SI) by: SIfat/SIwater+SIfat. Estimated tumour volume (eTV) and DWI's ADC of each FL was also calculated. Difference in FF, eTV and ADC between Pre and 8W studies was assessed by Wilcoxon matched pairs test. Disease response was assessed by IMWG criteria. FF, eTV and ADC receiver operating characteristic (ROC) area under the curve (AUC) analysis was conducted for prediction of non-responders at the end of induction.
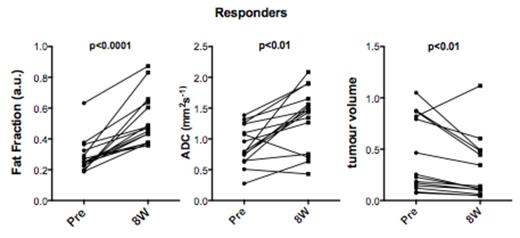
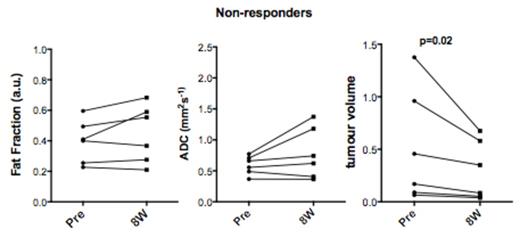
Results. 21 patients (13 male), median age 52 (range 36-69) were enrolled. Patients had IgG (13), IgA (4) or LC MM (4), and 7 had adverse FISH results [t(4;14), t(14;16), 1q+ or del(17p)] with median ISS II (ISS I (8), II (10), III (3)). Each received a bortezomib induction regimen (16 PAD, 3 CVD, 2 VTD) for 4-6 cycles. A total of 325 FLs were analysed in the entire cohort, with a median of 20 (IQR 10-20, mean 15.5) FLs per patient. At baseline (Pre), median or mean eTV, FF or ADC was found to be independent of ISS stage or genetic risk. Fifteen patients (71%) had an overall response (³PR) to induction therapy. Response was not found to correlate with median FL count, baseline (Pre) FF, eTV or ADC. However, at 8W a significant increase in FF was observed in responders (from median 0.25 to 0.47 a.u. at 8W, p<0.0001), but no change was seen in non-responders (p=0.22); eTV significantly decreased in both groups (from median 0.22 to 0.11 and 0.31 to 0.21 for responders and non-responders, respectively p<0.01 and p=0.02). ADC increased in responders (from median 0.79 to 1.46 x 10⁻³ mm2 /s at 8W, p<0.01) but was not significantly changed in the non-responder group (p=0.2).
One responding patient had only 1 FL and was excluded from per patient analysis. Of the remaining 14 responders, 13 had a significant increase in FF (p<0.01-0.02) and decrease in eTV (p<0.01-0.02), the 14th patient had only 4 FLs, with a non-significant increase in FF and no change in eTV; 8/14 demonstrated an increase (p<0.01-0.03) and 1/14 (p=0.01) a decrease in ADC. The remaining patients (5/14) had no significant changes in ADC (p=0.24-0.6).
All patients who failed to achieve at least PR (6) had no changes in FF (p values 0.10-0.80); 4/6 had no change in ADC (p=0.10-0.84) whilst 2/6 showed a significant increase (p=0.02, 0.03). All non-responders (6/6) had a significant decrease in eTV (p<0.01-0.02). Percentage changes in FF, eTV and ADC at 8W had an ROC-AUC of 1.0, 0.48 and 0.72 for prediction of response at 6 months.
Conclusions. WB-MRI derived FF change of FLs at 8 weeks following induction therapy differentiates responders from non-responders in newly diagnosed MM patients. This may have utility to act as both an early response and predictive imaging biomarker.
Yong:Takeda: Honoraria; Amgen: Honoraria; BMS: Honoraria; Novartis: Consultancy; Janssen: Honoraria; Autolous: Consultancy. Popat:Janssen: Honoraria.
Author notes
Asterisk with author names denotes non-ASH members.


This feature is available to Subscribers Only
Sign In or Create an Account Close Modal