Abstract
Background: Many institutions have implemented massive transfusion protocols (MTPs) to prevent hemodilution and to restore normal coagulation function, with the ultimate goal of controlling hemorrhage and reducing complications. Our institution issues two different MTPs: trauma (T-) and non-trauma (NT-). T-MTPs have a 1:1 ratio for red blood cell (RBC):plasma issued by the blood bank, whereas NT-MTPs have a 1.8:1 ratio. Appropriate blood product ratios, indications and patient outcomes in the NT-MTP setting are not well studied. To determine how various MTP parameters impact 24-hour patient mortality, we retrospectively reviewed MTP activations at our large academic urban medical center.
Methods: All activated MTPs over a 3-year period (2012-2014) were reviewed. Data was collected from blood bank quality assurance and inpatient electronic medical records. NT-MTPs were sub-classified into indication by type of hemorrhage. All statistical analyses (binary logistic regression, Kruskal-Wallis) were performed using STATA version 11. A p value of <0.05 was considered significant.
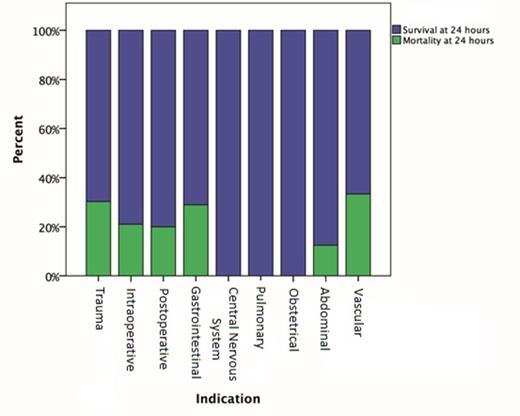
Results: From 2012-2014, there were 177 MTP activations for 167 patients, of which 98 were male (59%) and 69 were female (41%). The average age of all patients was 56 years, with a range of 7 months to 95 years. Trauma patients (mean age 40 years) tended to be younger than non-trauma patients (mean age 60 years). Refer to Table 1 for types of hemorrhage and ratios of blood products transfused. Thirty-eight patients (22.8%) died within 24 hours of MTP activation, including 10 (30.3%) of the trauma patients and 28 (21.7%) of the non-trauma patients (Figure 1). Mortality did not vary significantly by type of hemorrhage or by ratio of RBC:plasma transfused, including patients receiving no plasma. For each additional RBC unit transfused, patients had a higher chance of dying (odds ratio [OR] 1.17; p=0.002, confidence interval 1.1-1.3) within 24 hours, after controlling for number of platelet, plasma, and cryoprecipitate units received. The overall median RBC:plasma ratio transfused was 1.7 (interquartile range [IQR] 1.3-2); T-MTPs had a median ratio of 1.4 (IQR 1.1-1.9) and NT-MTPs had a median ratio of 1.7 (IQR 1.3-2.1). There was no significant difference in RBC:plasma ratios clinicians transfused for different types of hemorrhage, despite the blood bank issuing different ratios to the clinicians for T-MTPs and NT-MTPs. The total number of RBCs, platelet units, and plasma units transfused did not differ by type of hemorrhage. In all MTPs, transfusion of platelets did not have a significant impact on 24-hour survival.
Conclusions: We found that only the number of RBC units transfused had a significant association (OR 1.17) with 24-hour mortality during an MTP. The RBC:plasma ratio, number of platelets or plasma, and use of platelets during an MTP did not affect 24-hour mortality. The number of RBC units transfused most likely reflects the clinician's assessment of the severity of the situation, and does not imply that the RBCs affected the 24-hour mortality. We found the ratio of products issued during an MTP was not what was actually transfused to patients, indicating that clinicians were not transfusing according to protocol. Specifically, for NT-MTPs overall, the RBC:plasma ratio transfused was lower than what the blood bank issued, indicating clinicians are choosing to infuse more plasma despite a lack of evidence in the non-trauma setting. Prospective randomized trials comparing different RBC:plasma:platelet ratios in NT-MTPs are warranted.
Blood Product Ratios Transfused by Type of Hemorrhage
| Type of Hemorrhage . | Number of Patients (%) . | RBC:Plasma - Median (IQR) . | RBC:Platelets - Median (IQR) . |
|---|---|---|---|
| Overall | 167 (100%) | 1.7 (1.3-2) | 5 (4-7) |
| Trauma | 33 (20%) | 1.4 (1.1-1.9) | 5.5 (3.7-8.4) |
| Postoperative | 50 (30%) | 1.6 (1.3-1.8) | 5 (3.5-6) |
| Gastrointestinal | 29 (17%) | 2 (1.7-2) | 5 (4-7) |
| Intraoperative | 20 (12%) | 1.6 (1.3-2.7) | 6.2 (3.3-7.5) |
| Abdominal | 11 (7%) | 2 (1.3-3.3) | 6 (4-7) |
| Vascular | 9 (5%) | 1.3 (1-2) | 5 (2-5) |
| Obstetrical | 8 (5%) | 2.2 (2-2.3) | 5 (4-7) |
| Central Nervous System | 4 (2%) | 1.8 (1.2-4) | 4.2 (4-4.3) |
| Pulmonary | 2 (1%) | 2 | 2 |
| Superficial Soft Tissue | 1 (0.5%) | 1 | N/A |
24-Hour Mortality by Type of Hemorrhage
No relevant conflicts of interest to declare.
Author notes
Asterisk with author names denotes non-ASH members.


This feature is available to Subscribers Only
Sign In or Create an Account Close Modal