Abstract

Introduction
Iron overload (IO) in transfusion-dependent anemias (Thalassemia major, Sickle Cell Disease, Diamond-Blackfan and Fanconi Anemia) persist after hematopoietic stem cell transplantation (HSCT) and can result in increased morbidity in long term survivors, e.g. nonspecific liver dysfunction, hepatic cell carcinoma, heart failure and endocrinological complications. To reduce IO, phlebotomy or iron chelation is a required and effective treatment.
Although existing recommendations for screening and prevention of late effects following HSCT suggest determining serum ferritin (SF) levels 1year post transplant, there are no clear guidelines for screening IO and initiating treatment.
It is well known that SF levels depend on several factors beyond IO, e.g. infection or graft versus host disease, thus it is very often elevated as an acute phase protein in the post-transplant period.
Aim of the Study
In a multicenter, retrospective study we analyzed the concordance between liver iron concentration (LIC) and SF in 90 measurements of 33 patients (median age 8.9 y, range 1-11 y) with transfusion-dependent anemias (Thalassemia major, Diamond-Blackfan and Fanconi Anemia) who underwent HSCT between 1996 and 2014. LIC was determined either by MRI-R2 (Ferriscan®) or SQUID liver susceptometry.
Statistical methods
We examine the concordance between the classification according to LIC and SF: for SF < 800 μg/L, SF > 800 μg/L, and for the total range of SF levels.
Pearson correlation was used to examine the relationship between paired values of LIC and SF.
To analyze the classification sensitivity of SF levels according to LIC ≥ 4.5 mg/gdw we applied receiver operating characteristic (ROC) analysis. This approach estimates the sensitivity and the specificity as function of each SF cut-off level. The predictive accuracy of SF measurements in predicting LIC classification was investigated by area under the ROC curve.
All statistical tests are two-sided with a significance level of 5%. Data analysis was performed using commercial software (R, ROCR package and Graph Prism software)
Results
Correlation between serum ferritin and LIC
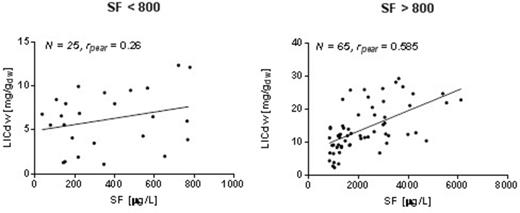
A moderate correlation among ferritin and LIC was found for the overall measurements (n=90). The Pearson coefficient correlation was equal to 0.69 (p<0.001), with 95% confidence interval [0.57 - 0.79]. When we analyzed the correlation between ferritin and LIC only for measurements with SF < 800 μg/L (n=25) the correlation coefficient is equal to 0.26. For this group, a very weak association among LIC and SF was found (p=0.2). In the group with SF > 800 μg/L (n=65) the relationship is moderate (p<0.001), with a Pearson correlation coefficient equal to 0.585 (Fig. 1).
Concordance of the classification according serum ferritin and LIC
In labor analysis and scans via MRI and SQUID technique the paired values of 90 LIC and SF were assessed. In accordance to the LIC threshold ≥4.5 mg/gdw 74 measurements demonstrated a demand of therapy. A total of 16 measurements did not indicate any requirement of therapy. A total of 65 measurements had SF ≥ 800 μg/L and 25 measurements had SF < 800 µg/l, indicated therapy onset and no therapy, respectively. The false positive rate was 22% (16/74) and the false negative rate was 44% (7/16). The overall error was 26% (23/90).
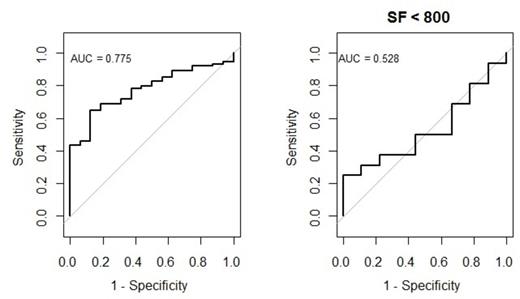
The predictive accuracy of SF to predict classification of LIC for the whole measurements was 77.5%. The accuracy for the measurements > 800 μg/L (n=65) was 81%. Instead, ROC analysis for SF measurements < 800 μg/L (n=25) indicates non-informative prediction (area=0.53) (Fig. 2).
Conclusion
The values of of SF > 800 μg/L are applicable for predicting the classification according to LIC at a threshold ≥ 4.5 mg/gdw.
A SF < 800 μg/L is not appropriate for predicting an initiating treatment of IO, because of a weak correlation (p=0.2) between paired SF and LIC values. Furthermore, the accuracy of SF indicated a non-informative prediction of classification according to LIC (ROC area = 0.53).
Our data suggest that initiating and stopping treatment of IO in transfusion dependent patients after HSCT should be done on the basis of LIC measured via MRI or SQUID instead of SF measurements only.
Grosse:Swedish Orphan Biovitrum: Honoraria; Novartis Oncology: Honoraria, Research Funding.
Author notes
Asterisk with author names denotes non-ASH members.

This icon denotes a clinically relevant abstract


This feature is available to Subscribers Only
Sign In or Create an Account Close Modal