Abstract
In patients with acute promyelocytic leukemia (APL), in spite of recent advances, early treatment related mortality (TRM) still remains a challenge and is largely related to the associated coagulopathy. It is well recognized that conventional coagulation parameters used in the clinic do not accurately predict the risk of adverse outcomes like major bleeding or thrombosis. There is limited data on the clinical utility of whole blood viscoelastic assays and extended coagulation parameters for evaluation of coagulopathy in patients with APL.
Consecutive patients with PML-RARA positive APL were enrolled. Blood samples were collected prior to infusion of blood products on day 1 and again on day 4 for thromboelastometry done on whole blood and activated with recombinant tissue factor at a final dilution of 1:50,000 (ROTEM analyzer, Tem Innovations GmbH, Basel) and an extended panel of coagulation parameters done by immunoassays (TAT complex, protein C, ATIII, PIC complex, tPAIC, d-dimer and thrombomodulin). Platelet count and conventional coagulation parameters, which were prothrombin time (PT), activated partial thromboplastin time (aPTT), fibrinogen and thrombin time (TT), were measured daily for the first 14 days (more frequently as clinically indicated). Patients received platelet transfusions to target a platelet count of 30x109/L (in the absence of bleeding). Fresh frozen plasma and cryoprecipitate transfusions were done to target a normal PT and aPTT and maintain a fibrinogen level above 140 mg%. Major bleeding, thrombosis and death during induction therapy were the outcome variables.
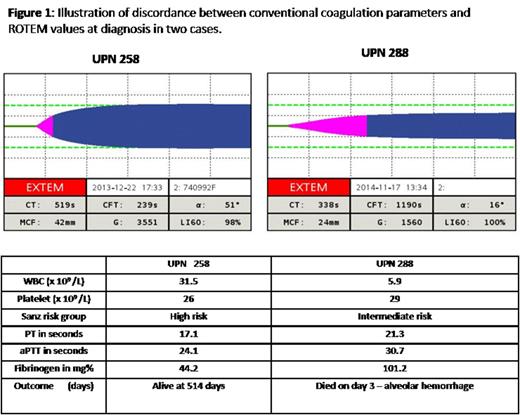
Of the 61 patients enrolled, 11 were excluded (3 did not continue treatment at our hospital, 2 died within 48 hours of admission, and 6 took discharge against medical advice before completing induction). Of the remaining 50 cases that were evaluated, 40 were newly diagnosed and 10 were relapsed. The median age was 34.5 years (range 9-68). 25 were males (50 %). The WBC count was above 10 x 109/L in 20 patients (40%). The median platelet count was 28 x 109/L (range 4-339). There were 13 (26%) deaths in induction. Six patients had a major bleeding event. Five patients had a thrombotic event. Of the evaluated conventional coagulation parameters, extended coagulation parameters, platelet counts and ROTEM parameters at diagnosis (ROTEM data not available at diagnosis in 2 cases) only the ROTEM parameter of maximum clot firmness (MCF) as a continuous variable was significantly associated with death (p=0.012). On univariate cox regression analysis with death as the outcome, MCF≤ 30mm was a poor prognostic marker (hazard ratio of 13.24, 95%CI 1.71-102.19; p =0.013). On multivariate cox regression analysis including high WBC count (>10 x 109/L), low platelet count (< 40 x 109/L) and history of relapse, MCF ≤30mm was an independent poor prognostic variable (HR: 11.89; 95% CI 1.43 - 98.75; p 0.022). Four of the 6 major bleeding events, four of five thrombotic events and all deaths related to coagulopathy occurred in patients with MCF ≤30mm. The descriptive statistics of patients with MCF >30mm (n=21) vs those with MCF ≤ 30mm (n=27) are shown in table 1. Figure 1 illustrates the type of discordance one can see between conventional coagulation parameters and ROTEM values.
This study suggests that the MCF value from a ROTEM assay at diagnosis is probably a better measure of the hemostatic defect at diagnosis in APL. Patients with APL with low MCF on ROTEM at diagnosis are at an increased risk of death during induction therapy despite an adequate blood product replacement strategy which was based on conventional coagulation parameters. In these patients, there is a need to develop novel and possibly a more intensive replacement strategy.
Comparison of baseline characteristics and clinical outcomes.
| Variables . | MCF ≤30 (n = 27) N (%) / Median (range) / Mean±SD . | MCF > 30 (n=21) N (%) / Median (range) / Mean±SD . | p value . |
|---|---|---|---|
| Age (years) | 40(12-68) | 27(9-48) | 0.006 |
| WBC >10 x x109/L | 17(62.96) | 2(9.52) | 0.003 |
| Platelet count (x109/L) | 17(4-89) | 45(10-339) | 0.001 |
| PT in seconds | 14.5(11-87.5) | 11.8(10.1-14.8) | 0.004 |
| aPTT in seconds | 28(23.2-77.9) | 30.2(22-53.6) | 0.104 |
| Fibrinogen in mg% | 134.8(24.7-393) | 172.2(14.7-549.5) | 0.066 |
| Major bleeding | 4(14.8) | 1(4.8) | 0.368 |
| Thrombosis | 4(14.8) | 1(4.8) | 0.369 |
| Death | 12(44.4) | 1(4.8) | 0.003 |
No relevant conflicts of interest to declare.
Author notes
Asterisk with author names denotes non-ASH members.


This feature is available to Subscribers Only
Sign In or Create an Account Close Modal