Abstract
Introduction: The haematological parameters, regulation of erythropoiesis, erythropoietin and body iron stores have been variably studied in dwellers and transient visitors from high altitude. Even in individuals born at high altitude, transient movements out of high altitude can significantly change these parameters. The role of this genetic adaption (reduced erythropoiesis) in Tibetans is well described (Moore LG et al, High Alt Med Biol 2001). There are scarce studies on true native highlanders and 'Ladakhi' populace from India which is geographically co-located to Tibet but of different ethnic origin (Wu TY et al, Zhongguo Ying Yong Sheng Li XueZaZhi. 2013).
Objective: To study complete blood counts including red cell and platelet indices in native highlanders and influence of high altitude living on body iron stores and serum erythropoietin levels in true native highlanders.
Methodology: True native highlanders in this study are defined as individuals born at altitudes above 11500ft with no descent to lower altitudes ever in their life. Baseline anthropometric data and peripheral oxygen saturations were collected. Haematological work up included total haemoglobin, haematocrit, total/ differential leucocyte count, platelets, red cell and platelet indices done by Sysmax® automated counter at Leh, Ladakh and serum erythropoietin/ ferritin levels at PGIMER, Chandigarh.
A total of 1328 children were screened of which 402 children (stratified by age 4-17years) were identified as true native highlanders. Guardians of 12 children didn't consent for the haematological evaluation.
Results: Study population included 197 males and 193 females. The mean age of study population was 127.58 + 39.64 months (range 35-254). The mean BMI was 18.7+2.5 kg/m2 (range 12.86-30.45). The mean peripheral oxygen saturation was 90.35 + 3.583 %.
The haematological parameters of the study population are described in table 1. There was statistically significant difference between males and females in haemoglobin concentration, RBC count, haematocrit, platelet count and platelet distribution width (p<0.001).
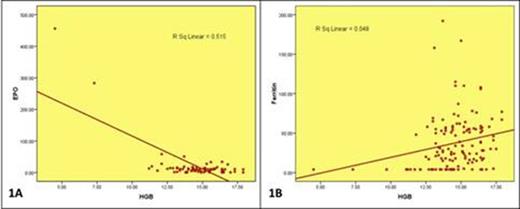
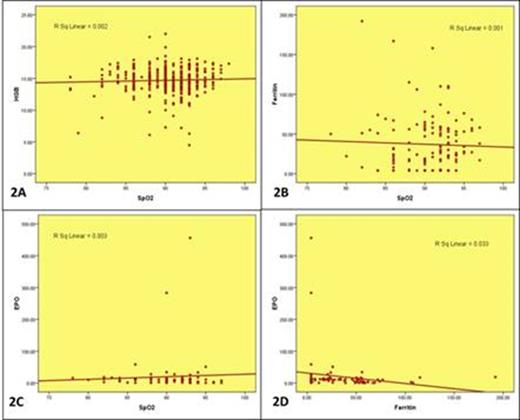
There was significant negative correlation between erythropoietin and haemoglobin concentration (r=0.718, p<0.001) (Fig 1A), serum ferritin and haemoglobin concentration(r:0.219, p=0.012) (Fig 1B). There was no significant correlation of peripheral oxygen saturation with haemoglobin concentration, serum ferritin or serum erythropoietin and of ferritin with EPO (Fig 2A-D).
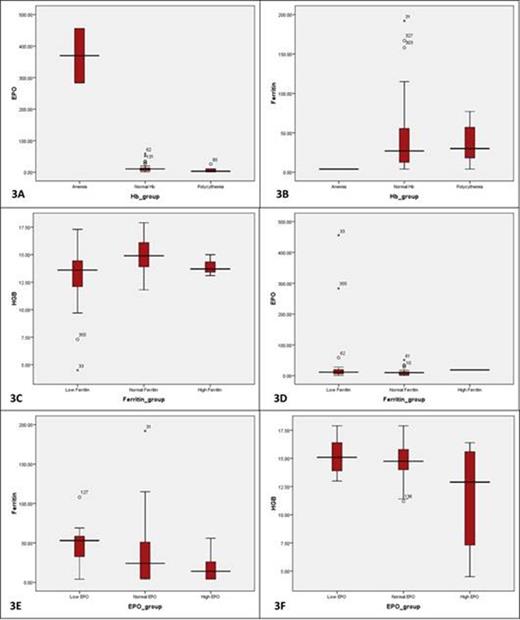
The prevalence of anaemia was 3.3% and polycythaemia was 17.2%. Low and high serum erythropoietin levels were seen in 18.8% and 7.5% respectively, low and high serum ferritin levels were seen in 23.9% and 2.2% respectively. The relation of haemoglobin groups with erythropoietin/ ferritin levels, ferritin groups with haemoglobin/ erythropoietin levels and erythropoietin groups with ferritin and haemoglobin levels are illustrated in Fig 3A-F.
Conclusion: There is no relation of haemoglobin to the oxygen saturation of the individuals. The serum erythropoietin and ferritin levels do correlate with the haemoglobin levels but not with the oxygen saturation. A considerable proportion of individuals have low to normal erythropoietin and ferritin levels.
Haematological parameters in true native highlanders
| . | N . | Minimum . | Maximum . | Mean . | Std. Deviation . |
|---|---|---|---|---|---|
| Haemoglobin (g/dL) | 360 | 4.50 | 22.00 | 14.6994 | 2.02690 |
| RBC count (x1012/L) | 357 | 4 | 8 | 4.95 | .517 |
| Hematocrit (%) | 357 | 18.57 | 70.70 | 40.6060 | 5.33243 |
| MCV (fL) | 362 | 50.49 | 101.00 | 82.1924 | 7.45698 |
| MCH (pg) | 357 | 12.27 | 38.92 | 29.7655 | 3.63519 |
| MCHC (g/dL) | 356 | 21.18 | 64.20 | 36.3159 | 4.57284 |
| RDW.CV | 183 | 11.27 | 31.70 | 15.1718 | 2.96735 |
| RDW_SD | 362 | 35.60 | 60.00 | 43.8874 | 3.52161 |
| WBC (x109/L) | 362 | 3430 | 15740 | 7599.72 | 1990.329 |
| Lympho (%) | 362 | 14 | 60 | 36.12 | 8.104 |
| Mixed (%) | 362 | 1 | 17 | 5.35 | 3.421 |
| Neutro (%) | 362 | 16 | 84 | 58.34 | 9.013 |
| ALC (x109/L) | 362 | 1 | 5 | 2.70 | .774 |
| ANC (x109/L) | 362 | 1 | 13 | 4.51 | 1.654 |
| PLT (x109/L) | 362 | 70 | 1352 | 376.86 | 147.814 |
| PDW (%) | 354 | 2.90 | 57.10 | 14.4107 | 5.56488 |
| MPV (fL) | 354 | 3.32 | 14.60 | 9.7340 | 1.63144 |
| PCT (%) | 183 | .03 | 1.47 | .4122 | .14302 |
| P.LCR (%) | 348 | 5.20 | 60.00 | 26.8528 | 9.78539 |
| Ferritin (µg/L) | 134 | 4.00 | 192.00 | 36.9403 | 34.05960 |
| EPO (mIU/L) | 80 | .78 | 456.00 | 19.9022 | 58.89438 |
No relevant conflicts of interest to declare.
Author notes
Asterisk with author names denotes non-ASH members.


This feature is available to Subscribers Only
Sign In or Create an Account Close Modal