Abstract
Introduction: the involvement of iron in a wide range of metabolic processes make it one of the essential elements for living organisms (Inamura et al., 2005). Anemia of chronic disease (ACD), also termed anemia of chronic inflammation, is the most prevalent anemia in subjects suffering from chronic diseases such as cancer and Chronic Kidney Disease (CKD). A central mechanism by which chronic disease causes anemia is the retention of iron in the reticuloendothelial system, causing a functional iron deficiency and consequently an insufficient iron supply for erythropoiesis. Hepcidin is a primarily liver-derived peptide that orchestrates body iron homeostasis and its expression increases in response to elevated iron stores, inflammation and ER stress (Maliken et al. 2011). In those conditions produced Hepcidin bind to the cellular iron exporter, Ferroportin (Fp1), resulting in Fp1 internalization and degradation with subsequent reduction of cellular iron release (Theurl et al., 2014). Some studies showed that pharmacological inhibition of Hepcidin could reverse cellular iron retetion and improve anemia in different models of inflammatory anemia (Steinbicker et al., 2011, Theurl et al., 2011). Moreover recent scientific publications suggest also a role of other dietary supplements in regulating Hepcidin, reducing its concentration and thus increasing circulating iron in blood (Zughaier et al. 2014). Sucrosomial Iron¨ (Sideral¨) is a new and still unique preparation of ferric pyrophosphate, useful for treatment of iron deficiency related anemia.
Aim: we have previously performed a clinical study in which we showed that Sucrosomial iron is able to increase Hemoglobin level in CKD patients (Pisani et al., 2014). On the basis of these results we have investigated the role of Sucrosomial Iron¨ in inflammation process. In particular, we studied the capability of Sucrosomial Iron¨ to reduce Hepcidin release in LPS -induced inflammation made in the hepatoma cell line (HepG2).
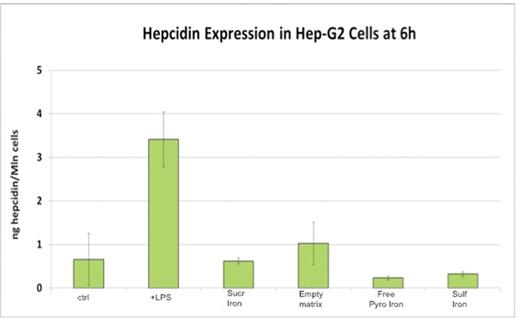
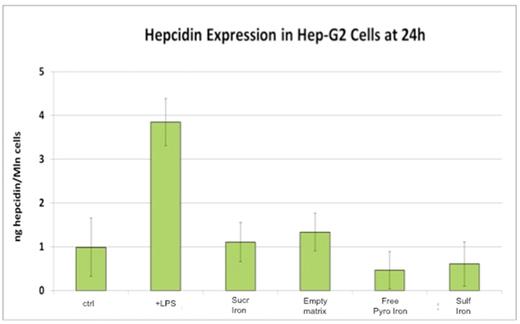
Results: Cells were incubated with LPS, treated with Sucrosomial Iron¨ and then analyzed for Hepcidin production in terms of protein expression at 6 and 24h after treatment with Sucrosomial Iron¨. Results showed that Sucrosomial Iron¨ is able to significantly reduce Hepcidin level both 6 and 24 h after sucrosome treatment compare to others iron formulations (Figure 1A-B).
Materilas and Methods: Sucrosomial Iron¨ preparation of ferric pyrophosphate convered by a; LPS: Lipopolysaccharides from Escherichia coli (Sigma-Aldrich); Empty matrix preparation of phospholipids plus sucrose esters of fatty acids.
Conclusions: This evidence should be considered as a preliminary investigation on the effect of Sucrosomial Iron¨ on the production of Hepcidin during chronic inflammation.
Bibliography
Inamura J et al. Upregulation of hepcidin by interleukin-1 in human hepatoma cell lines. Hepatology Research 33 2005 198-205.
Maliken BD et al., The Hepcidin Circuits Act: Balancing Iron and Inflammation, Hepatology. 2011 May ; 53(5): 1764-1766;
Theurl M et al. Hepcidin as a predictive factor and therapeutic target in erythropoiesis- stimulating agent treatment for anemia of chronic disease in rats Haematologica. 2014 Sep;99(9):1516-24. Epub 2014 Jun 3.
Theurl et al. Pharmacologic inhibition of hepcidin expression reverses anemia of chronic inflammation in rats. Blood. 2011;118(18): 4977-84.
Steinbicker AU et al. Inhibition of bone morphogenetic protein signaling attenuates anemia associated with inflammation Blood. 2011 May 5;117(18):4915-23. doi: 10.1182/blood-2010-10-313064. Epub 2011 Mar 10.
Zughaier SM et al. The role of vitamin D in regulating the iron-hepcidin-ferroportin axis in monocytes. J Clin Transl Endocrinol. 2014 Mar 21;1(1):19-25.
Pisani et al. Effect of oral liposomal iron versus intravenous iron for treatment of iron deficiency anaemia in CKD patients: a randomized trial. Nephrol Dial Transplant. 2015 Apr;30(4):645-52. Epub 2014 Nov 13.
This graph shows the level of Hepcidin produced by LPS treated HepG2 cells 6 hours after treatment with iron compounds.
This graph shows the level of Hepcidin produced by LPS treated HepG2 cells 6 hours after treatment with iron compounds.
This graph shows the level of Hepcidin produced by LPS- treated HepG2 cells 24 hours after treatment with iron compounds.
This graph shows the level of Hepcidin produced by LPS- treated HepG2 cells 24 hours after treatment with iron compounds.
Tarantino:Pharmanutra s.p.a.: Employment. Brilli:Pharmanutra s.p.a.: Employment.
Author notes
Asterisk with author names denotes non-ASH members.


This feature is available to Subscribers Only
Sign In or Create an Account Close Modal