Abstract
Cellular prion protein (PrPC) is a GPI-anchored cell surface glycoprotein that is expressed in the brain, blood, bone marrow (BM), and lymphoid tissue. PrPC can be converted post-translationally into scrapie-PrP (PrPSc), which is involved in the pathogenesis of neurodegenerative diseases including Creutzfeldt-Jakob disease, Kuru disease in humans, and scrapie and bovine spongiform encephalopathy in animals. However, the biological function of PrPSc has yet to be conclusively elucidated.
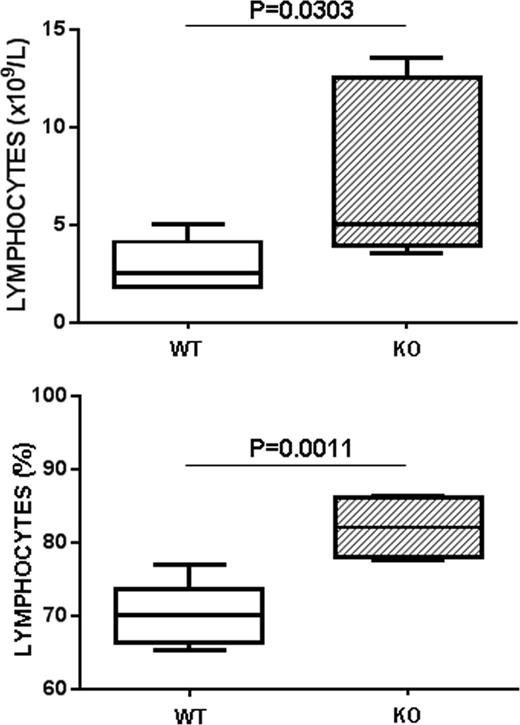
In order to understand the role of PrPC in the hematopoietic system, we compared bone marrow, lymphoid organs and peripheral blood of PrPC knockout mice (KO) to age and sex-matched transgenic mice used as background controls (WT) expressing human PrPC under the control of a mouse PrPC promoter with a slightly augmented expression (2-fold) of PrPC. Complete blood count (CBC) showed a significant increase of WBC in KO mice (KO 9.03 ± 5.16 x10⁹/L vs. WT 4.13 ± 1.87 x10⁹/L, p = 0.0405; Table 1 and Figure 1). Further analysis of WBC differential revealed that the elevated number of WBC in KO mice was due to lymphocytosis. Specifically, KO mice had a 3-fold increase in the absolute lymphocyte count (KO 7.59 ± 4.63 x10⁹/L vs. WT 2.90 ± 1.32 x10⁹/L, p = 0.0303), as well as a higher lymphocyte percentage (KO 82.47 ± 4.20% vs. WT 70.19 ± 4.44%, p = 0.0011) compared to controls. KO mice also had a trend toward higher hemoglobin (KO 12.00 ± 4.40 g/dL vs. WT 9.84 ± 4.83 g/dL), RBC (KO 8.01 ± 2.87 x10¹²/L vs. WT 6.25 ± 3.11 x10¹²/L), and hematocrit (KO 43.94 ± 17.00 % vs. WT 36.04 ± 18.07 %) compared to WT mice. Additionally, platelet count in KO mice was higher than control mice (KO 762.20 ± 138.61 x 10⁹/L vs. WT 661.80 ± 230.20 x 10⁹/L). Of interest, the mean platelet volume (platelet size) was significantly increased in KO mice compared to controls (KO 6.00 ± 0.29 fL vs. WT 5.24 ± 0.56 fL, p =0.0140). Thus, absence of PrPC resulted in significant leukocytosis and specifically higher absolute count and percentage of lymphocytes, as well as larger platelets in peripheral blood.
To further analyze if the observed lymphocytosis is due to abnormalities in hematopoiesis or lymphopoiesis, bone marrow (BM), thymus, spleen and lymph nodes from WT and KO mice were isolated and examined by flow cytometry using a comprehensive panel of fluorochrome-conjugated antibodies specific for all hematologic cell precursors/lineages. Analysis of all cell populations in each of these organs revealed no significant differences in the numbers of RBC and megakaryocyte in BM, and of lymphocytes in the thymus, spleen and lymph nodes (data no shown). Additionally, histological analysis of BM, thymus, spleen and lymph nodes tissue from KO and WT animals failed to show morphological differences between the two groups (data not shown). Therefore, lack of PrPC does not appear to affect hematopoiesis and lymphopoiesis.
In summary, our findings indicate that PrPC deficiency translates into a significant increase in the number of lymphocytes in peripheral blood; however, development and maturation of lymphocytes in KO mice appeared normal. Therefore, PrPC might be critical in the survival and trafficking of lymphocytes in peripheral blood. The molecular mechanisms underlying the observed changes in lymphocytes and platelets, and whether there are any related changes in the functions of lymphocytes and platelets will be subject of future studies.
Complete blood count (CBC) of PrPC WT and KO mice
| . | WT . | KO . | p value . |
|---|---|---|---|
| Mean ± SD | Mean ± SD | ||
| WBC (109/L) | 4.13 ± 1.87 | 9.03 ± 5.16 | 0.0405 |
| Absolute lymphocyte count (109/L) | 2.90 ± 1.32 | 7.59 ± 4.63 | 0.0303 |
| Lymphocyte (%) | 70.19 ± 4.44 | 82.47 ± 4.20 | 0.0011 |
| RBC (1012/L) | 6.25 ± 3.11 | 8.01 ± 2.87 | 0.1898 |
| HB (g/dL) | 9.84 ± 4.83 | 12.00 ± 4.40 | 0.2404 |
| HCT (%) | 36.04 ± 18.07 | 43.94 ± 17.00 | 0.2618 |
| PLT (109/L) | 661.80 ± 230.20 | 762.20 ± 138.61 | 0.2138 |
| MPV (fL) | 5.24 ± 0.56 | 6.00 ± 0.29 | 0.0140 |
SD: Standard deviation; WBC: White blood cell; RBC: Red blood cell; HB: Hemoglobin; HCT: Hematocrit; RDW: Red cell distribution width; PLT: Platelet; MPV: Mean platelet volume
PrPC deficiency results in lymphocytosis in peripheral blood.
PrPC deficiency results in lymphocytosis in peripheral blood.
No relevant conflicts of interest to declare.
Author notes
Asterisk with author names denotes non-ASH members.


This feature is available to Subscribers Only
Sign In or Create an Account Close Modal