Abstract
Background: Despite prophylactic platelet (PLT) transfusions, used to prevent bleeding in chemotherapy induced thrombocytopenia(CIT), some patients will still bleed, whereas others are spared even without PLT transfusion. Little research has been done on (hyper)fibrinolysis as a risk factor for bleeding in CIT. In this study a tPA-induced fibrinolysis in ROTEM was analysed to gain more insight in clot formation and clot lysis times in patients with CIT before and after PLT transfusions.
Aim: to study clot vulnerability for fibrinolysis in CIT patients with tPA-ROTEM.
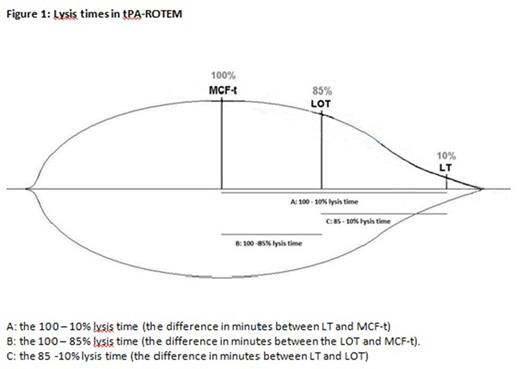
Method: patients, older than 18 years, treated for a hematological malignancy and receiving a prophylactic PLT transfusion for thrombocytopenia were included. Blood was collected before PLT transfusion (baseline) as well as 1 hour and 24 hours after transfusion. A modified, EXTEM based,ROTEM in the presence of tPA was used to study the occurrence of fibrinolysis. The maximum clot firmness (MCF) and the time to maximum clot firmness (MCF-t) were determined. Also, 100-10% lysis times (A), 100-85% lysis times (B) and 85- 10% lysis times (C) were calculated. Reference values for the tPA-ROTEM were obtained from 40 healthy volunteers.
Results: patient characteristics are shown in table 1. Baseline platelet counts and fibrinogen concentrations were median 6,000/mcL and 4,6 g/L, respectively (table 2). In the tPA-ROTEM a significant increase in MCF, MCF-t, 100-10% LT and 100-85% LT after transfusion was observed. The MCF remained significantly increased after 24 hrs (table 2). When baseline was compared to the healthy volunteers, the MCF, MCF-t were remarkably reduced in the CIT patients. The 100 -10% lysis time was significantly shorter in patients with CIT ( (27,4 versus 34,4 minutes, (P=0.020) (table 3), mainly due to a shorter 100 -85% LT (11.5 versus 17.9 (P<0,001). There were no differences in the 85 - 10% lysis times. A positive, moderate strength correlation was found between the 100-85% lysis times and fibrinogen concentrations (R=0,499 (P=0,035)).
Conclusion: Patients with CIT have a shorter lysis times as measured with tPA-ROTEM than healthy volunteers, mainly occurring during the first phase (100-85%) of fibrinolysis. Higher fibrinogen concentrations were associated with a longer duration of the initial phase. Lysis times outcomes in tPA-ROTEM may be applicable in clinical trials assessing PLT transfusions.
Patient characteristics:
| . | N=20 . | SD . | Min- max . |
|---|---|---|---|
| Age | 55 (mean) | 13 | 23-72 |
| Men (%) | 10 (50%) | ||
| Diagnosis | 9 Acute myeloid leukaemia 4 Multiple myeloma 4 Non-Hodgkin Lymphoma 3 Other | ||
| Treatment | 7 Induction therapy (35%) 13 Consolidation therapy and stem cell transplantation (65%) |
Results from baseline, 1h and 24h measurements (all as median)
| . | . | Baseline n=18 . | 1h N=19 . | 24h N=18 . | Healthy volunteers N=40 . | Reference values . |
|---|---|---|---|---|---|---|
| Platelet Count median | *109/L | 6*# | 33*# | 21*# | 173 | 150-400 x109/L |
| Fibrinogen median | (g/L) | 4.58# | 4.40# | 4.64*# | 3.18 | 1.70-4.00 |
| Maximum Clot Firmness | mm | 23 # | 38*# | 34*# | 59 | |
| Time to Maximum Clot Firmness | Min. | 11.5# | 15.7* | 15.3# | 18.2 | |
| Lysis Onset Time | Min. | 23.0# | 29.7*# | 28.3# | 36.1 | |
| Lysis Time | Min. | 38.9# | 44.4*# | 44.6# | 52.6 |
* = P<0,05 versus baseline.
# = P=<0,05 versus Healthy volunteers.
Differences in lysis time speed between baseline measurement and healthy volunteers
| . | Unit . | Patient group baseline . | Healthy volunteers . | Mean difference . | P-value . |
|---|---|---|---|---|---|
| 100 - 10% lysis time | Min. | 27.4 | 34.4 | 7 | 0.020 |
| 100 - 85% lysis time | Min. | 11.5 | 17.9 | 6,4 | <0.001 |
| 85 - 10% lysis time | Min. | 15.0 | 15.3 | 0,3 | 0.705 |
No relevant conflicts of interest to declare.
Author notes
Asterisk with author names denotes non-ASH members.


This feature is available to Subscribers Only
Sign In or Create an Account Close Modal