Abstract
Introduction
Despite the discovery of new genetic alterations the cytogenetically normal acute myeloid leukemia (CN-AML) subset is still insufficiently characterized. As mRNA-sequencing (RNA-seq) is becoming more accessible, sequencing of the transcriptome could reveal not only information regarding deregulated expression patterns in leukemias, but also enable mutational evaluation of expressed alleles. To address this issue we performed RNA-seq of 5 AML patients from diagnostic bone marrow aspirates to assess the validity of the following: 1) remission samples can be used as control, 2) concordance between standard clinical laboratory analysis and RNA-seq data, and 3) implementation of existing microarray data repository to infer expected mutational status of the sequenced samples based on expression patterns.
Methods
Diagnostic samples were selected among patients with high leukemic blast fraction (mean of 75%) and paired remission samples with very low, or no detectable, molecular minimal residual disease. A panel of recurrent somatic mutations was assessed by means of quantitative PCR (qPCR) and fragment analysis for sequencing comparisons. Sequencing was performed on single HiSeq lane aimed at minimum 66 million reads per sample (AROS Applied Biotechnology, Aarhus, Denmark). Biomedical Genomics Workbench 2 was employed for alignment, mutation calling and analysis of differential expression (Robinson-Smyth exact test, Bonferroni corrected). R and Mathematica were used for comparison of expression patterns from the individual samples in conjunction with CN-AML (251) and control bone marrow (73) data from microarray repositories (Gene Expression Omnibus, GSE15434 and GSE13159).
Results
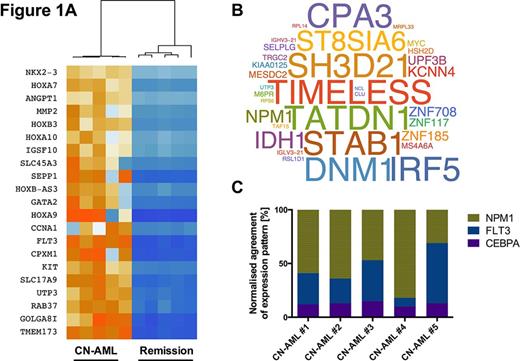
259 genes were differentially expressed as defined by the following thresholds: normalized fold-change > 2, expression range values > 10 RPKM and p<0.05. Of these, 41 genes were upregulated in AML samples (p<0.01 subset heatmap is shown in fig. 1A). Supervised clustering of the samples on the basis of differential expression patterns efficiently divided the data into 2 groups according to diagnosis and remission status (fig. 1A, dendrogram). A median of 61 mutations per sample was observed (35 to 675). Thirty-four mutations occurred twice or more (fig. 1B, size reflects transcript fraction of mutated allele).
A close correlation between routine molecular diagnostics and sequencing data was found. As expected, routine minimal residual disease marker WT1 was in agreement and found to be clearly expressed at diagnosis, but not at time of remission.
By comparing patient expression patterns with NPM1, FLT3 or CEPBA mutation specific microarray expression signatures we were largely able to deduce expected mutational status for each patient (fig. 1C, showing the individual matching fraction of mutation specific gene expression signature in terms of upregulated or downregulated) in favor of qPCR analysis shown in table 1.
Comparison of mutational status from qPCR/RNA-seq
| . | FLT3mut . | NPM1mut . | IDH1mut . | WT1mut . | CEBPAmut . | KITmut . |
|---|---|---|---|---|---|---|
| #1 | +/+ | +/+ | +/+ | -/- | -/- | -/- |
| #2 | +/+ | +/+ | -/- | -/- | -/- | -/- |
| #3 | +/+ | +/- | -/- | -/- | -/- | -/- |
| #4 | -/- | +/- | +/+ | +/- | -/- | -/- |
| #5 | +/+ | -/- | -/- | -/- | -/- | -/- |
Conclusions
This approach serves as a proof of the concept that RNA-sequencing can be directly implemented in the routine laboratory. Moreover, transcriptome data such as these can extend the molecular survey in a dynamic manner by aiding in therapy-related decision-making for the application of targeted therapy and for delineating the reasons for treatment. While publicly available repositories of RNA-seq data are being generated for referencing, it is possible to include microarray data to support molecular classification of the individual patients, as is shown here.
No relevant conflicts of interest to declare.
Author notes
Asterisk with author names denotes non-ASH members.


This feature is available to Subscribers Only
Sign In or Create an Account Close Modal