Abstract
BACKGROUND
A key event in the lifecycle of Human Immunodeficiency Virus (HIV) is permanent integration into the infected cells genome. In addition to allowing long-term persistence of the virus, this results in a trackable mark carried in all infected cells. Active HIV replication represses cellular pathways, preventing further cell division. This would imply that any specific integration site (IS) which is clonally expanded either during active or repressed viral infection arises from either a dormant/inactive virus, or is perturbing local gene expression, leading to increased cell proliferation. Alternatively, a cell carrying HIV provirus could proliferate due to T-cell specific antigen stimulation. By analyzing the patterns of integration sites detected in cell cultures and tissue samples from animal models of HIV infection, we can better understand the basic virology of integration site selection and determine what may potentially drive infected cells to persist despite effective treatment regimens.
METHODS
Jurkat reporter cell lines or primary human CD4+ cells were cultured and infected with various strains of HIV including both CCR5 and CXCR4 tropic viruses. Infected cells were cultured up to 21 days post infection, then analyzed for HIV proviral integration sites by next-generation sequencing. For in vivo studies, NSG mice were infused with human CD34+ hematopoietic stem/progenitor cells, resulting in a reconstituted human immune system including high levels of CD4+ T cells capable of sustaining HIV infection. After 16 weeks post-challenge, tissues were collected and subjected to integration site analysis for HIV proviral DNA. Identified integration sites were mapped and compared across multiple parameters to identify chromosomal regions and associated genes enriched for integration events, as well as clonally expanded cells in vivo.
RESULTS
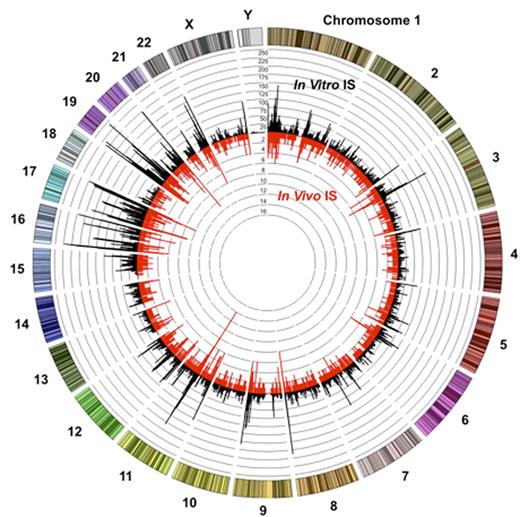
Genome-wide analysis of HIV integration sites reveals a remarkably similar chromosomal landscape both in tissue culture infection of Jurkat cells and in vivo infection data (Figure 1), as well as across multiple HIV strains. As previously observed, the majority of integrations occur near or within gene coding regions thought to be actively transcribed at time of infection. However, certain areas of the genome, and even unique genes, are enriched for IS in individual samples. In addition to these genomic regions of enrichment, we also observe specific clonal outgrowth of unique integration events in genes previously unidentified in the literature. Three genes in particular exhibit a significant increase of integration events during acute infection which are 3x higher than predicted by random chance alone. We also observe integration events in genes that have been documented by other labs in HIV+ clinical patient samples, however in our active infection models, we do not see those specific genes enriched or expanded. This could indicate that these genes play a role in persistence that is only present during anti-retroviral therapy which suppresses active replication.
CONCLUSIONS
We have cataloged the most extensive HIV IS library to date in both relevant tissue culture models and in vivo infection studies, including over 245,000 unique integration events and three different HIV strains commonly used in research. Genome-wide correlation studies reveal regions significantly enriched for HIV integrations and genes which repeatedly exhibit clonal outgrowth in multiple animals. These types of studies are now being applied to human patient samples to determine if latency and persistence of infection can be mapped to unique integration events or genes of interest. Such information may indicate when and how the latent HIV reservoir is seeded and what types of therapy or treatments are most effective at targeting and eliminating these populations.
Circos plot comparing HIV integrations sites (IS) identified either during in vitro cell culture infections (black bars), or in vivo infection studies using humanized mice (red bars). The outer ring is composed of human chromosomes each of which are divided into 25kB fragment bins. Total number of unique integration sites identified in each bin is represented by the height of the histogram bars. The in vitro IS concentric ring scale represents increments of 25 outwards up to 250 while the in vivo IS scales inwards in increments of 2 up to 16.
Adair:Rocket Pharmaceuticals: Consultancy, Equity Ownership.
Author notes
Asterisk with author names denotes non-ASH members.


This feature is available to Subscribers Only
Sign In or Create an Account Close Modal