Abstract
INTRODUCTION. Most studies of AML biomarkers have examined cryopreserved mononuclear cells (MNCs) obtained from repositories. These MNCs typically include non-leukemic cells (e.g., lymphocytes) and heterogeneous populations of viable and nonviable AML blasts at various stages of differentiation. We hypothesize that these variables negatively impact the prognostic power of current biomarkers. In an attempt to improve the prognostic power of such biomarkers, we examined enriched populations of viable AML blasts from 190 randomly selected AML patients on SWOG trials. To our knowledge, this study represents the largest examination of the quality of cryopreserved AML blasts and the potential prognostic benefit of enriching for viable leukemic blasts.
METHODS. Cryopreserved bone marrow (BM, N=124) and peripheral blood (PB, N=116) samples from 190 AML patients on SWOG trials (SWOG-9031, SWOG-9333, S0106, and S0112) were randomly selected. The samples were thawed and sorted for viable AML blasts using a combination of fluorochrome-conjugated antibodies and DAPI. DNA and RNA were extracted and evaluated from both the unsorted AML samples (A-MNCs) and viable AML blasts (A-Blasts). FLT3-ITD allelic ratio (AR) was quantified by fragment analyses. Expression of 13 potentially prognostic transcripts was quantified via quantitative RT/PCR: BAALC, CCNA1, CEBPA, ERG1, EVI1, FLT3, GATA2, IL3RA, JAG1, KIT, MN1, RUNX1, and WT1. Fold expression differences were computed by the comparative CT method. Associations between quantitative biomarkers (FLT3-ITD AR and transcript expression) and survival (overall, OS and relapse-free, RFS) were analyzed using Cox proportional hazards regression, with interaction terms for biomarker by cell population (A-MNCs vs. A-Blasts) or CD34 expression (separately for A-MNCs and A-Blasts). A predetermined FLT3-ITD AR cutoff of 0.5 was utilized based on results by Schneider et al. (Blood, 2012) and others. For paired samples, BM was used.
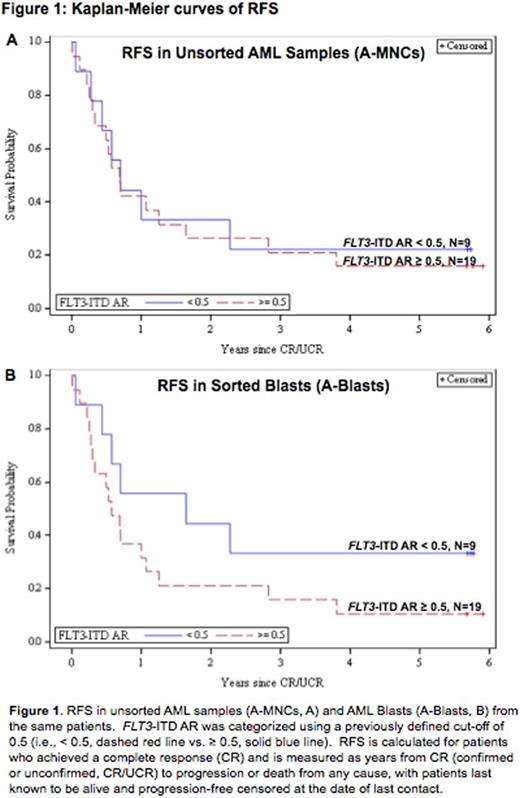
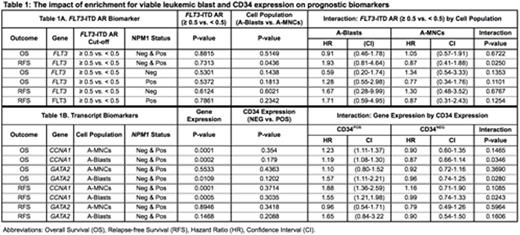
RESULTS. Lymphocyte percentage varied (median 7.1%, range 0.4 - 70.1%) and was correlated with patients' pre-treatment blast percentages (rs = -0.29, P = 0.0002). Viability by DAPI varied widely (median 66.5%, range 5.2 - 95.6%), and AML blasts displayed inter- and intra-sample immunophenotypic heterogeneity, with the slight majority expressing CD34 (54%) using a predetermined immunofluorescence cut-off > 104. For OS, there was no significant difference (P=0.67) in the effect of FLT3-ITD AR between A-Blasts (HR=0.91, P=0.78) and A-MNCs (HR=1.05, P=0.88). However, for RFS, the effect of FLT3/ITD AR differed significantly (P=0.025) between A-Blasts (HR=1.93, P=0.14) and A-MNCs (HR=0.87, P=0.73). Kaplan-Meier curves of RFS by FLT3-ITD AR for A-MNCs (Figure 1A) and A-Blasts (Figure 1B) also suggest this trend. A similar, but nonsignificant, trend towards higher HRs in A-Blasts was displayed in analyses restricted to NPM1 mutated patients (Table 1). Similar analyses did not show such a striking interaction between cell population and transcript biomarkers, but we found that most transcripts displayed significant associations with immunophenotype (data not shown). Therefore, we examined if CD34 expression might impact the prognostic value of transcripts, separately by cell population. The expression of two genes (CCNA1 and GATA2) displayed significant interactions with CD34 expression in relation to clinical outcomes (Table 1). Moreover, the interaction between biomarker and CD34 expressions differed depending on which cell population was examined, such that the interaction was significant in the A-Blasts but not A-MNCs.
CONCLUSION. Cryopreserved samples vary widely in percentages of non-leukemic, dying cells and differentiation stage of leukemic blasts. These factors impact the measurement of quantitative biomarkers and may also impact the significance and prognostic value of these biomarkers. Future studies must consider the effects that sample viability, composition, and differentiation stage may have on quantitative biomarkers. In addition, we are examining the potential impact that mutations in other genes (e.g., ASXL1, DNMT3A, RUNX1, etc.) may have on our results.
ACKNOWLEDGEMENT. The authors wish to gratefully acknowledge the important contributions of the late Dr. Stephen H. Petersdorf to SWOG and to study S0106.
SUPPORT. NIH/NCI grants CA160872,CA180819, CA180828, and CA180888.
Wood:Seattle Genetics: Honoraria, Other: Laboratory Services Agreement; Amgen: Honoraria, Other: Laboratory Services Agreement; Pfizer: Honoraria, Other: Laboratory Services Agreement; Juno: Other: Laboratory Services Agreement. Erba:Jannsen: Consultancy, Research Funding; Sunesis: Consultancy; Gylcomimetics: Other: DSMB; Agios: Research Funding; Celgene: Consultancy, Speakers Bureau; Seattle Genetics: Consultancy, Research Funding; Amgen: Consultancy, Research Funding; Incyte: Consultancy, DSMB, Speakers Bureau; Novartis: Consultancy, Speakers Bureau; Ariad: Consultancy; Astellas: Research Funding; Millennium Pharmaceuticals, Inc.: Research Funding; Pfizer: Consultancy; Daiichi Sankyo: Consultancy; Celator: Research Funding; Juno: Research Funding. Othus:Celgene: Consultancy; Glycomimetics: Consultancy. Radich:Incyte: Consultancy; Novartis: Consultancy, Research Funding; Ariad: Consultancy; Gilliad: Consultancy.
Author notes
Asterisk with author names denotes non-ASH members.


This feature is available to Subscribers Only
Sign In or Create an Account Close Modal