Abstract
BACKGROUND: Chronic kidney disease (CKD) is a prevalent complication of sickle cell disease (SCD) and associated with early mortality. Hemoglobinuria is a risk factor for the development and progression of CKD. Discovery and validation of non-invasive biomarkers for early stage renal disease are needed to facilitate optimal CKD treatment. Mass-spectrometry analysis of patient urine is a modern method for biomarker discovery. Urine from patients with late stages of glomerular disease contains a large number of abundant plasma proteins that overwhelm and complicate mass-spectrometry analysis. Thus, analysis of samples collected before the onset of kidney disease is a promising approach. Abnormal renal iron metabolism including cortical iron deposition is characteristic of SCD nephropathy. Ceruloplasmin is a ferrioxidase that is important facilitator of cellular iron export by ferroportin and of iron binding by transferrin.
OBJECTIVES: We aimed to use mass-spectrometry to determine urinary biomarkers in SCD patients without renal disease that may predict the development of CKD and to validate the biomarkers by ELISA.
METHODS: Mass-spectrometry analysis was performed on urine samples from eight University of Illinois at Chicago (UIC) SCD patients without CKD. Proteins were identified using Proteome Discoverer 1.4 and quantified using SIEVE 2.0 program. Ceruloplasmin concentrations were determined by ELISA in these eight subjects for the validation of our mass spectrometry analysis findings plus an additional 12 UIC SCD patients without CKD. Urine ceruloplasmin and free hemoglobin concentrations were determined by ELISA in an additional 34 UIC SCD patients with CKD stage ranging from 0-5.
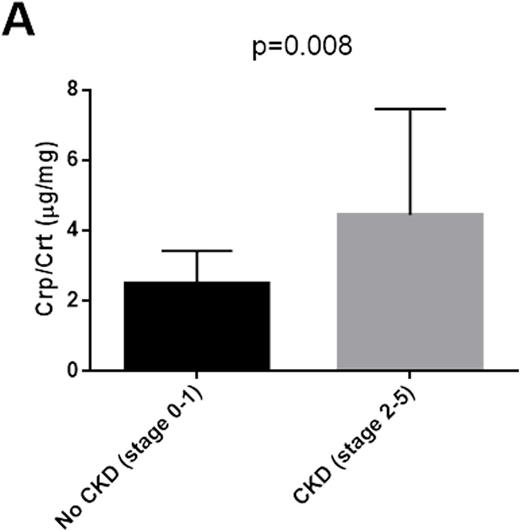
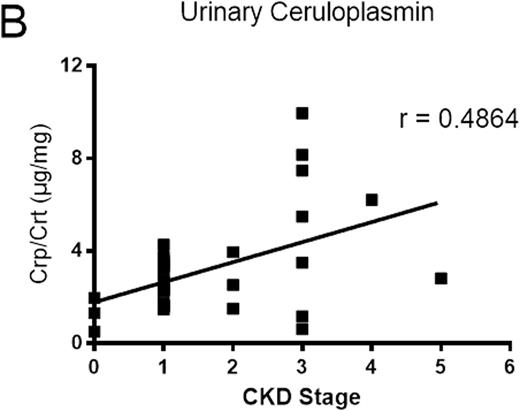
RESULTS: Label-free quantitative proteomic analysis of urine samples collected from SCD patients without CKD showed greater ceruloplasmin levels in 2 samples with hemoglobinuria versus 6 samples without hemoglboinuria (37.4-fold, p=2.7x10⁻⁸). Analysis of all twenty non-CKD samples by ELISA showed 2.5-fold higher levels of ceruloplasmin in hemoglobinuria samples (p=0.003). To determine whether urine ceruloplasmin correlated with CKD stage, we analyzed an additional 34 samples with and without CKD. Samples with CKD stages 2-5 (N=12) demonstrated higher levels of ceruloplasmin than stages 0-1 (N=22) (1.7-fold increase, p=0.008) (Figure 1A). In an additional analysis of these results, individual CKD disease stage correlated with urinary concentrations of ceruloplasmin (N=34, r=0.49, p=0.0035) (Figure 1B) and cell free hemoglobin (N=34, r=0.45, p=0.007) (Figure 1C). The correlation of ceruloplasmin concentration with CKD stage in the SCD patients showed high sensitivity and specificity (area under curve 90.7±6.8; p-value=0.018) by ROCK analysis. Finally, urinary ceruloplasmin concentration demonstrated a strong correlation with free hemoglobin concentration (r=0.79).
CONCLUSIONS: Urinary ceruloplasmin may complement urinary free hemoglobin as a non-invasive biomarker of risk for CKD in SCD patients.
ACKNOWLEDGMENTS: This work was supported by NIH Research Grants 1P50HL118006, 1R01HL125005, 5G12MD007597 and K23HL125984. The content is solely the responsibility of the authors and does not necessarily represent the official view of NHLBI, NIMHD or NIH.
No relevant conflicts of interest to declare.
Author notes
Asterisk with author names denotes non-ASH members.


This feature is available to Subscribers Only
Sign In or Create an Account Close Modal