Abstract
Background
Despite the majority of DLBCL patients achieve long-term disease-free survival with standard chemo-immunotherapy, almost 30% of patients relapse or have refractory disease (1).Thus, there is an unmet need to identify patients with resistant disease as early as possible with the aim to change or intensify the treatment. The Revised International Prognostic Score (R-IPI) is considered a reliable tool for predicting outcome of DLBCL patients, but it is not able to predict the early outcome in individual patients. The importance of positron emission tomography (PET) to detect treatment failure in Hodgkin lymphoma patients has been highly recognized and International guidelines recently suggested that PET-computed tomography (PET-CT) can be used to determine the response assessment by Deauville criteria in fluorodeoxyglucose (FDG)-avid lymphomas (2).
In a large series of patients, we recently showed that absolute monocyte count (AMC) has prognostic value in patients with DLBCL (3). Here, we analyze the role of PET at the end of treatment compared with the value of AMC at diagnosis, showing a close correlation between the two of them, and if the data will be confirmed, the combination of AMC at diagnosis to the final PET (F-PET) response might allow more accurate identification of patients outcome.
Patients and Method
At Modena Cancer Center approximately 200 patients affected by DLBCL have been treated between 2007 and 1014. So far we collected and analyzed the data of the first 32 patients treated between 2012 and 2014, and further analysis will be extended to the quinquennial 2007-2012. Data are comprehensive of clinical characteristics, blood differential, response to the therapy, survival outcome and PET scan. Patients were treated with rituximab and combination chemotherapy with cyclophosphamide, doxorubicin, vincristine, and prednisone (CHOP) or CHOP-like. The response was evaluated based on 2007 Cheson criteria. The PET results were revised using Deauville criteria, and F-PET with score >3 was considered positive. AMC at diagnosis > 630/mmc were considered predictive of poor prognosis. Pearson correlation coefficient was computed to evaluate the correlation by AMC in continuous form with Deauville score. Progression free survival (PFS) was assessed by Kaplan-Meier estimates and compared by risk groups using the log-rank (LR) test and permutated LR (10000 Monte Carlo Simulation).
Results
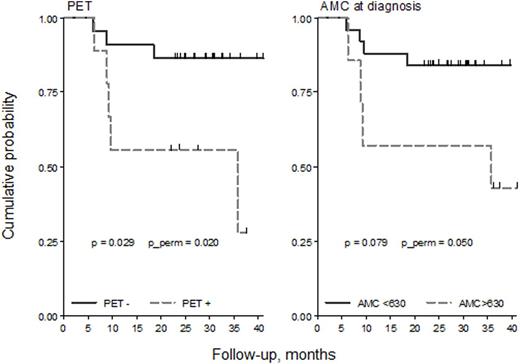
Here we report the earliest results of an ongoing study, based on the analysis of the first 32 patients. The median age was 60 years (range 25-83), 44% were males, 69% had stage III-IV, and 22% had B symptoms. After chemo-immuno therapy 75% of patients obtained a complete response, 13% partial response and 13% had progressive disease. The 22 patients with F-PET negative showed a median AMC of 630/mmc, while the 9 patients with F-PET positive had a median AMC of 670/mm3, p=0.019. The median follow up was 29 months (range:10-50), and at 2 years the PFS for all patients was 78% (95%CI: 60-89%). The PFS at 2 years based on the F-PET was 86% (95%CI: 63-95%) for PET negative, and 56% (95%CI: 20-80%) for PET positive (Fig1). The LR test between the curves and permutated LR was statistically significant (p=0.029 and p=0.020). The PFS at 2 years by AMC <630/mmc and > 630/mmc at diagnosis was 84% (95%CI: 63-94%), and 57% (95%CI: 17-84%),respectively (Fig1). The LR test between the curves and permutated LR was marginally statistically significant (p=0.079 and p=0.050) . The Pearson correlation showed a good positive linear correlation of AMC with Deauville score (R=0.8).
Conclusion.
Although retrospective and with a limited number of patients enrolled so far, our study shows that both F-PET evaluated with Deauville criteria and AMC at the diagnosis are strong prognostic factors, able to discriminate patients with different PFS. We hypothesize that the similar trend of the two curves is the expression of two aspects of the disease, with positive PET reflecting the persistence of the lymphoma, and the elevated AMC in the peripheral blood a biomarker of the tumor microenvironment/cytokines. Based on this hypothesis and on the strong prognostic value of both parameters, we will try to compute a risk score, after the analysis of the entire cohort.
References:
Morton LM et al. 2006; 107:265.
Tadmor T, et al. Haematologica. 2014; 99:125.
Meignan M, et al. Leuk Lymphoma. 2012; 53, 1876.
No relevant conflicts of interest to declare.
Author notes
Asterisk with author names denotes non-ASH members.


This feature is available to Subscribers Only
Sign In or Create an Account Close Modal