Abstract
The outcome for patients with Multiple Myeloma (MM) is highly variable. Understanding the prognosis for a particular patient can help when selecting the intensity of treatment to be used and the frequency of reviews. The quantification of heavy/light chains pairs by the immunoassay Hevylite (HLC) allows us a precise measurement of monoclonal and non-monoclonal immunoglobulins of the same isotype. In this study we evaluate i) the impact of the "HLC ratio" defined as monoclonal immunoglobulin over isotype matched non-monoclonal immunoglobulin (involved/uninvolved HLC ratio or i/u HLC ratio), ii) the suppression of non-monoclonal pair denominated "HLC-matched pair suppression" and iii) the effect of "systemic immunoparesis", at diagnosis and at +100 days after autologous stem cell transplant (ASCT).
Methods: 85 patients (50 M:35 F) with a median age of 70 years (56-78) were followed (35 IgGK, 18 IgGl, 17 IgAK and 15 IgAl) for a median of 19 (5-30) months. Sixteen patients (18%) presented ISS stage I, 15 (28%) stage II and 54 (64%) stage III. Thirty transplanted patients were evaluated at day +100 of ASCT. Serum free light chains (FLC) and immunoglobulin heavy/light chain pairs (HLC) were assessed by Freelite and Hevylite assays, respectively (The Binding Site, UK). FLC, HLC, b2-microglobulin, albumin, creatinine, hemogloblin, calcium, LDH, bone marrow plasma cell infiltration, presence of lytic bone lesions and ISS stage were evaluated for their impact on patient´s outcome. Statistical analysis with SPSS 23. Overall survival (OS) and progression-free survival (PFS) were evaluated by Kaplan-Meier method and Cox Regression.
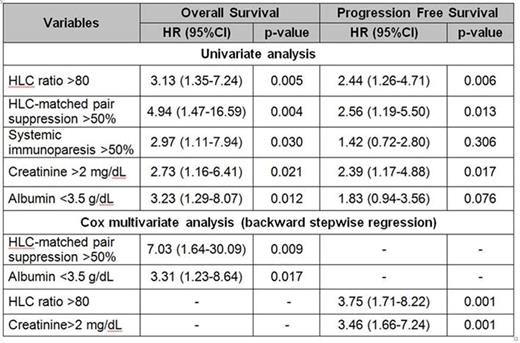
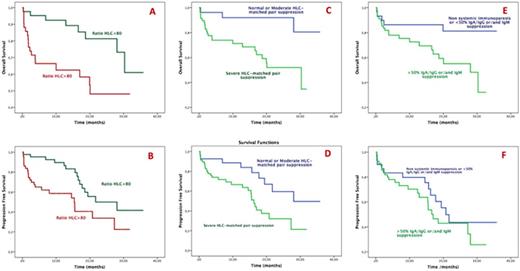
Results: The median OS of the 85 patients was 54% and 26 patients deceased during the study due to MM. The median value of i/u HLC ratio at diagnosis was 80 (31.5-319.71) and values >80 were significantly associated with worse OS (48 vs. 61%, p=0,005, fig.1A and Table 1) and shorter PFS (23% vs. 42%, p=0,006, fig.1B). Severe HLC-matched pair suppression (i.e. more than 50% below the lower reference range) was identified in 68% of the newly diagnosed patients and was associated with shorter OS (35% vs. 81%, p=0,004, fig. 1C) and PFS (21% vs. 50%, p=0,013, fig.1D). Severe (>50%) systemic immunoparesis was identified in 64% of the patients and was also significantly associated with shorter OS (32% vs. 81%, p=0,030, fig.1E) but not with shorter PFS (26% vs. 44%, p=0,306, fig. 1F). In a multivariate analysis, severe HLC-matched pair suppression and albumin were found as independent risk factors for OS whereas creatinine and i/u HLC ratio >80 were independent risk factors for PFS.
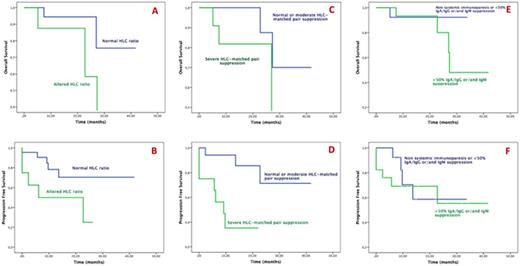
In the post-ASCT evaluation of the patients (n=30), normalization of HLC Ig´k/Ig´l ratio was observed in 8 patients (27%). An altered HLC ratio was predictive of shorter PFS after ASCT (25% vs. 70%, HR: 3,42, 95%CI 1,12-11,97, p=0,039, fig. 2B) and with a trend towards a worse OS (p=0,072, fig. 2A). Severe HLC-matched pair suppression was found in 12 patients (40%) and was predictive of worse OS (0% vs 70%, HR: 10,63, 95%CI: 1,11-114,11, p=0,023, fig.2C) and shorter PFS (35% vs. 71%, HR: 8,87, 95%CI: 1,72-45,92, p=0,002, fig. 2D). The severe systemic immunoparesis observed in 17 patients (57%) was not associated with OS (p=0,644, fig.2E) or PFS (p=0,750, fig. 2F).
Conclusions: Severe HLC-matched pair suppression and i/u HLC>80 are associated with worse OS and shorter PFS in MM patients suggesting a potential use of these parameters as prognostic biomarkers in newly diagnosed patients. Severe HLC-matched pair suppression is an independent risk factor for OS whereas i/u HLC>80 is independently associated with shorter PFS. In patients after ASCT, severe HLC-matched pair suppression reflects the persistence of clonal cells that is not associated with severe systemic immunoparesis.
Analysis of prognostic factors for OS and PFS in newly diagnosed MM patients. Only significant variables are shown.
Analysis of prognostic factors for OS and PFS in newly diagnosed MM patients. Only significant variables are shown.
Newly diagnosed MM patients. OS (A) and PFS (B) by i/u HLC ratio >80; OS (C) and PFS (D) according to severe (>50%) HLC-matched pair suppression; OS (E) and PFS (F) according to severe (>50%) systemic suppression.
Newly diagnosed MM patients. OS (A) and PFS (B) by i/u HLC ratio >80; OS (C) and PFS (D) according to severe (>50%) HLC-matched pair suppression; OS (E) and PFS (F) according to severe (>50%) systemic suppression.
MM patients at day +100 after ASCT. OS (A) and PFS (B) by HLC ratios; OS (C) and PFS (D) according to severe (>50%) HLC-matched pair suppression; OS (E) and PFS (F) according to severe (>50%) systemic suppression.
MM patients at day +100 after ASCT. OS (A) and PFS (B) by HLC ratios; OS (C) and PFS (D) according to severe (>50%) HLC-matched pair suppression; OS (E) and PFS (F) according to severe (>50%) systemic suppression.
Barbosa:The Binding Site: Employment. Pais:The Binding Site: Employment.
Author notes
Asterisk with author names denotes non-ASH members.


This feature is available to Subscribers Only
Sign In or Create an Account Close Modal