The publisher’s compositor introduced a number of errors in the figures during the publication process. The publisher apologizes for the errors, which were corrected in the online version of the article on 26 January 2022. The figures were correct in the Blood First Edition version of the article.
Page 723, Figure 1: In panel A, the colors of the Kaplan-Meier survival curves for WT and Ifnlr1−/− were reversed. The lower survival curve should be blue, and the middle curve should be red. Furthermore, the color coding of WT, Ifnlr1−/−, and TCD in panels D-F was inconsistent with that in panels A-B and I-J. WT should be represented by red, Ifnlr1−/− should be represented by blue, and TCD should be represented by green.
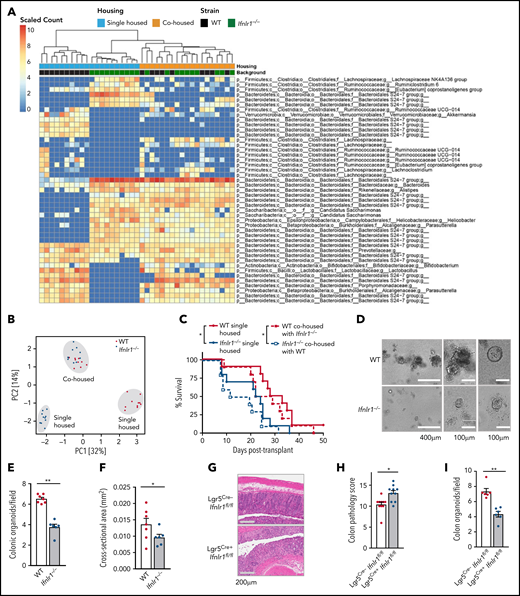
Page 726, Figure 4: In the “Scaled Count” bar in panel A, the label 4 was in the wrong place and the labels 2 and 0 were missing. Asterisks indicating statistical significance were omitted from panel C. The labeling of the Cre+ and Cre− images in panel G was reversed. The x-axes in panels H and I were mislabeled.
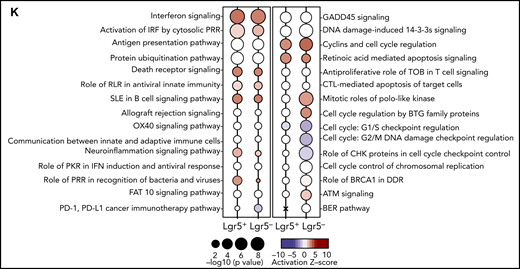
Page 728, Figure 5K: The sequencing data were erroneously recolored during production.
Page 730, Figure 6: The sequencing data were erroneously recolored during production.
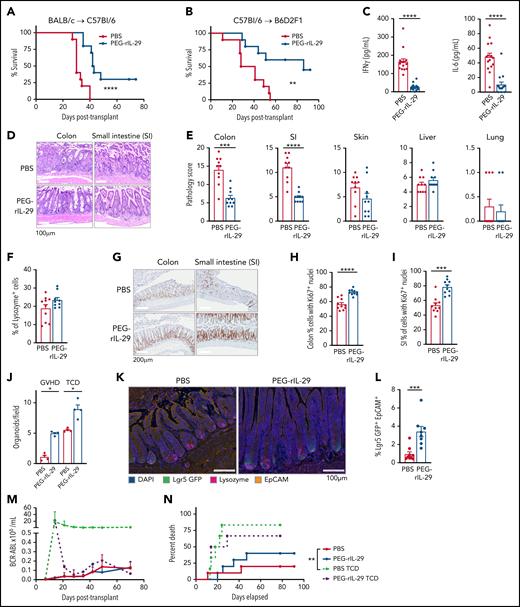
Page 732, Figure 7: The colors of some error bars were incorrect. In panel J, under GVHD, the x-axis label EG-rIL-29 should be PEG-rIL-29. The coloring of groups in panel M has been corrected for consistency with panel N.
The corrected figures are shown below.
IFN-λ signaling in recipient tissue determines GVHD severity. (A) Survival by Kaplan-Meier estimates for B6.WT (n = 31) and B6.Ifnlr1–/– (Ifnlr1–/–, n = 31) recipient mice lethally irradiated (1000 cGy) and transplanted with BALB/c-derived BM and T cells. A non-GVHD control group received T cell–depleted BM only (TCD; n = 10). Data combined from 5 experiments. (B) Clinical GVHD scores + SEM. (C) Representative images of colon and SI at day 7 after BMT. (D) Semiquantitative GVHD histopathology scores at day 7 after BMT (WT and Ifnlr1–/–, n = 9; TCD, n = 6, combined from 2 experiments). (E) Serum fluorescein isothiocyanate (FITC) dextran at day 7 post-BMT (WT, n = 10; Ifnlr1–/–, n = 9; combined from 2 experiments). (F) Serum IFN-γ, IL-6, tumor necrosis factor (TNF), and IL-17A at day 4 post-BMT (WT and Ifnlr1–/–, n = 23; TCD, n = 10; combined from 3 experiments). (G) IL-28A/B measured in sera, SI, and colon from naive and 24 hours postirradiation (1000 cGy) WT mice (n = 9, combined from 2 experiments). SI and colon mucosal homogenates were prepared, and the IL28-A/B amounts in mucosal supernatants corrected for each gram of tissue. (H) IL-28A/B concentration in serum and SI mucosal homogenates as for panel G at days 1, 3, and 7 after lethal irradiation (1000 cGy) and transplantation with BALB/c BM and T cells or TCD only (n = 9, combined from 2 experiments). (I-J) B6D2F1 recipients were transplanted with BM and T cells from WT or Ifnlr1–/– donors. Survival (I) and GVHD clinical scores (J) (GVHD groups, n = 12; TCD, n = 8; combined from 2 experiments). Data are presented as mean ± SEM. P values were calculated by using the 2-tailed Mann-Whitney t test. Kaplan-Meier survival was compared by using the log-rank Mantel-Cox test. *P < .05, **P < .01, ***P < .001, ****P < .0001.
IFN-λ signaling in recipient tissue determines GVHD severity. (A) Survival by Kaplan-Meier estimates for B6.WT (n = 31) and B6.Ifnlr1–/– (Ifnlr1–/–, n = 31) recipient mice lethally irradiated (1000 cGy) and transplanted with BALB/c-derived BM and T cells. A non-GVHD control group received T cell–depleted BM only (TCD; n = 10). Data combined from 5 experiments. (B) Clinical GVHD scores + SEM. (C) Representative images of colon and SI at day 7 after BMT. (D) Semiquantitative GVHD histopathology scores at day 7 after BMT (WT and Ifnlr1–/–, n = 9; TCD, n = 6, combined from 2 experiments). (E) Serum fluorescein isothiocyanate (FITC) dextran at day 7 post-BMT (WT, n = 10; Ifnlr1–/–, n = 9; combined from 2 experiments). (F) Serum IFN-γ, IL-6, tumor necrosis factor (TNF), and IL-17A at day 4 post-BMT (WT and Ifnlr1–/–, n = 23; TCD, n = 10; combined from 3 experiments). (G) IL-28A/B measured in sera, SI, and colon from naive and 24 hours postirradiation (1000 cGy) WT mice (n = 9, combined from 2 experiments). SI and colon mucosal homogenates were prepared, and the IL28-A/B amounts in mucosal supernatants corrected for each gram of tissue. (H) IL-28A/B concentration in serum and SI mucosal homogenates as for panel G at days 1, 3, and 7 after lethal irradiation (1000 cGy) and transplantation with BALB/c BM and T cells or TCD only (n = 9, combined from 2 experiments). (I-J) B6D2F1 recipients were transplanted with BM and T cells from WT or Ifnlr1–/– donors. Survival (I) and GVHD clinical scores (J) (GVHD groups, n = 12; TCD, n = 8; combined from 2 experiments). Data are presented as mean ± SEM. P values were calculated by using the 2-tailed Mann-Whitney t test. Kaplan-Meier survival was compared by using the log-rank Mantel-Cox test. *P < .05, **P < .01, ***P < .001, ****P < .0001.
Ifnlr1-signaling in Lgr5+ ISCs provides nonhematopoietic protection from GVHD. (A) Heat map displaying differentially abundant operational taxonomic units consistently increased or decreased in separately housed or cohoused B6 WT and/or Ifnlr−/− mice. Cohousing was performed for 4 weeks before transplantation (n = 10 per strain and housing condition, combined from 2 experiments). (B) Principal component analysis of fecal microbial composition for mice as in panel A. (C) Survival of recipients in panel A transplanted with BALB/c BM + T cells. (D) Representative images. (E-F) Numbers (E) and size (F) of GI organoids grown from colonic crypt isolates and enumerated at day 5 (n = 6-7, combined from 3 experiments). (G-H) Representative images (G) and semiquantitative GVHD histopathology scores (H) at day 7 after BMT from tamoxifen-treated Cre-positive or Cre-negative Lgr5Cre.Ifnlr 1fl.fl recipient mice (n = 10, combined from 2 experiments). (I) Numbers of GI organoids grown from colonic crypt isolates and enumerated at day 5 from mice as in panels D-E (n = 6, combined from 2 experiments). Data are presented as mean ± SEM. P values were calculated by using the 2-tailed Mann-Whitney t test. Survival calculated by using the log-rank Mantel-Cox test. *P < .05, **P < .01. PC1, first principal component; PC2, second principal component.
Ifnlr1-signaling in Lgr5+ ISCs provides nonhematopoietic protection from GVHD. (A) Heat map displaying differentially abundant operational taxonomic units consistently increased or decreased in separately housed or cohoused B6 WT and/or Ifnlr−/− mice. Cohousing was performed for 4 weeks before transplantation (n = 10 per strain and housing condition, combined from 2 experiments). (B) Principal component analysis of fecal microbial composition for mice as in panel A. (C) Survival of recipients in panel A transplanted with BALB/c BM + T cells. (D) Representative images. (E-F) Numbers (E) and size (F) of GI organoids grown from colonic crypt isolates and enumerated at day 5 (n = 6-7, combined from 3 experiments). (G-H) Representative images (G) and semiquantitative GVHD histopathology scores (H) at day 7 after BMT from tamoxifen-treated Cre-positive or Cre-negative Lgr5Cre.Ifnlr 1fl.fl recipient mice (n = 10, combined from 2 experiments). (I) Numbers of GI organoids grown from colonic crypt isolates and enumerated at day 5 from mice as in panels D-E (n = 6, combined from 2 experiments). Data are presented as mean ± SEM. P values were calculated by using the 2-tailed Mann-Whitney t test. Survival calculated by using the log-rank Mantel-Cox test. *P < .05, **P < .01. PC1, first principal component; PC2, second principal component.
IFN-λ treatment produces a proliferative phenotype in GI stem cells. (K) Functional enrichment analysis of differentially expressed genes: canonical pathway enrichment analysis (log2 fold-change .0.58, and adjusted P value <.05) in sorted Lgr5+ and Lgr5− epithelial cells after in vivo PEG-rIL-29 treatment relative to genotype-matched PBS-treated samples using Ingenuity pathway analysis. Enrichment of canonical pathways associated with immune responses (left) and regulation of cellular proliferation (right). Bubbles represent significant pathway enrichment, as determined by Fisher’s exact test. Bubble diameter represents the log10P value as determined by Fisher’s exact test. Crosses signify a lack of significant pathway enrichment, color indicates predicted pathway activation (red) or predicted inhibition (blue), and white bubbles represent significant functional enrichment of pathways with no available prediction patterns.
IFN-λ treatment produces a proliferative phenotype in GI stem cells. (K) Functional enrichment analysis of differentially expressed genes: canonical pathway enrichment analysis (log2 fold-change .0.58, and adjusted P value <.05) in sorted Lgr5+ and Lgr5− epithelial cells after in vivo PEG-rIL-29 treatment relative to genotype-matched PBS-treated samples using Ingenuity pathway analysis. Enrichment of canonical pathways associated with immune responses (left) and regulation of cellular proliferation (right). Bubbles represent significant pathway enrichment, as determined by Fisher’s exact test. Bubble diameter represents the log10P value as determined by Fisher’s exact test. Crosses signify a lack of significant pathway enrichment, color indicates predicted pathway activation (red) or predicted inhibition (blue), and white bubbles represent significant functional enrichment of pathways with no available prediction patterns.
Predicted activation state of PEG-rIL-29–treated Lgr5+ and Lgr5– sorted GI epithelial cells. Cytokines (A), transcriptional regulators (B), and kinases (C) with significantly associated transcriptional changes in sorted Lgr5+ and Lgr5– intestinal epithelial cells after in vivo PEG-rIL-29-administration using Ingenuity pathway analysis. Bubble plot representation of significant enrichment scores (activation z score >2) in at least one treatment condition (ie, PEG-rIL-29). Color indicates predicted activation (red) or predicted inhibition (green), and bubble diameter represents the −log10P value as determined by Fisher’s exact test. Crosses signify a lack of significant activation scores at specific time points.
Predicted activation state of PEG-rIL-29–treated Lgr5+ and Lgr5– sorted GI epithelial cells. Cytokines (A), transcriptional regulators (B), and kinases (C) with significantly associated transcriptional changes in sorted Lgr5+ and Lgr5– intestinal epithelial cells after in vivo PEG-rIL-29-administration using Ingenuity pathway analysis. Bubble plot representation of significant enrichment scores (activation z score >2) in at least one treatment condition (ie, PEG-rIL-29). Color indicates predicted activation (red) or predicted inhibition (green), and bubble diameter represents the −log10P value as determined by Fisher’s exact test. Crosses signify a lack of significant activation scores at specific time points.
IFN-λ treatment protects from GVHD within the GI tract. PEG-rIL-29 or PBS was given as previously described on days −2, −1, and 0 to BMT recipients. (A) Survival by Kaplan-Meier analysis of B6 recipients transplanted with BALB/c BM + T cells (n = 10, combined from 2 experiments). (B) Survival by Kaplan-Meier analysis of B6D2F1 recipients transplanted with B6 BM + T cells (n = 10, combined from 2 experiments). (C) B6 recipients were transplanted with BALB/c BM + T cells. Serum IFN-γ and IL-6 at day 4 after BMT as in panel A (n = 15, combined from 3 experiments). (D) Representative images of colon and SI at day 7 post-BMT. (E) Semiquantitative GVHD histopathology scores at day 7 post-BMT (n = 10, combined from 2 experiments). (F) Paneth cell numbers. (G) Representative images of proliferation in colon and SI using Ki-67 at day 7 after BMT. (H-I) Quantification of Ki-67 expression at day 7 post-BMT in colon (n = 10, combined from 2 experiments) (H) and in SI (as in panel H) (I). (J) B6 recipients were transplanted with BALB/c BM ± T cells and crypt isolates obtained 7 days later. Colon organoids were quantified (n = 4, combined from 2 replicate experiments). (K-L) Representative images (K) and enumeration (L) of Lgr5+ ISCs in tissue sections at day 7 post-BMT from ileum from PBS or PEG-rIL-29 recipients of BALB/c BM + T cells after NK-cell depletion with NK1.1 on day −1 (1 mg), day +3 (0.5 mg), and day +6 (0.5 mg), (n = 9, combined from 2 experiments). (M) B6D2F1 recipients were treated with PBS or PEG-rIL-29, then transplanted with BM ± T cells from B6.WT donors, together with recipient type BCR-ABL nup98hoxA9 leukemia expressing GFP. (M) The number of GFP+ leukemia cells was determined in peripheral blood thereafter (n = 10, combined from 2 experiments). (N) Death from leukemia in recipients transplanted as in panel M. Data are presented as mean ± SEM. P values were calculated by using the 2-tailed Mann-Whitney t test. Survival was calculated by using the log-rank Mantel-Cox test. *P < .05, **P < .01, ***P < .001, ****P < .0001. DAPI, 4′,6-diamidino-2-phenylindole; TCD, T cell–depleted.
IFN-λ treatment protects from GVHD within the GI tract. PEG-rIL-29 or PBS was given as previously described on days −2, −1, and 0 to BMT recipients. (A) Survival by Kaplan-Meier analysis of B6 recipients transplanted with BALB/c BM + T cells (n = 10, combined from 2 experiments). (B) Survival by Kaplan-Meier analysis of B6D2F1 recipients transplanted with B6 BM + T cells (n = 10, combined from 2 experiments). (C) B6 recipients were transplanted with BALB/c BM + T cells. Serum IFN-γ and IL-6 at day 4 after BMT as in panel A (n = 15, combined from 3 experiments). (D) Representative images of colon and SI at day 7 post-BMT. (E) Semiquantitative GVHD histopathology scores at day 7 post-BMT (n = 10, combined from 2 experiments). (F) Paneth cell numbers. (G) Representative images of proliferation in colon and SI using Ki-67 at day 7 after BMT. (H-I) Quantification of Ki-67 expression at day 7 post-BMT in colon (n = 10, combined from 2 experiments) (H) and in SI (as in panel H) (I). (J) B6 recipients were transplanted with BALB/c BM ± T cells and crypt isolates obtained 7 days later. Colon organoids were quantified (n = 4, combined from 2 replicate experiments). (K-L) Representative images (K) and enumeration (L) of Lgr5+ ISCs in tissue sections at day 7 post-BMT from ileum from PBS or PEG-rIL-29 recipients of BALB/c BM + T cells after NK-cell depletion with NK1.1 on day −1 (1 mg), day +3 (0.5 mg), and day +6 (0.5 mg), (n = 9, combined from 2 experiments). (M) B6D2F1 recipients were treated with PBS or PEG-rIL-29, then transplanted with BM ± T cells from B6.WT donors, together with recipient type BCR-ABL nup98hoxA9 leukemia expressing GFP. (M) The number of GFP+ leukemia cells was determined in peripheral blood thereafter (n = 10, combined from 2 experiments). (N) Death from leukemia in recipients transplanted as in panel M. Data are presented as mean ± SEM. P values were calculated by using the 2-tailed Mann-Whitney t test. Survival was calculated by using the log-rank Mantel-Cox test. *P < .05, **P < .01, ***P < .001, ****P < .0001. DAPI, 4′,6-diamidino-2-phenylindole; TCD, T cell–depleted.


This feature is available to Subscribers Only
Sign In or Create an Account Close Modal